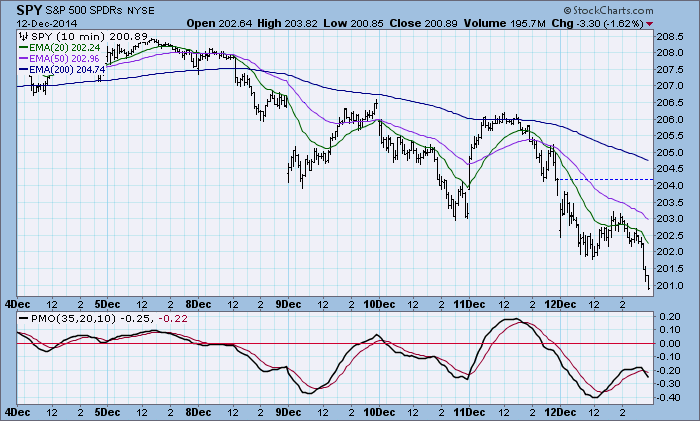
The market opened down today and quickly took out Wednesday's lows. There was an attempt at consolidation, but it finally broke down to close very near the lows for the day. SPY has declined about -3.8% from the all-time high reached last week.
The purpose of the DecisionPoint Daily Update is to quickly review the day's action, internal condition, and Trend Model status of the broad market (S&P 500), the nine SPDR Sectors, the U.S. Dollar, Gold, Crude Oil, and Bonds. To ensure that using this daily reference will be quick and painless, we are as brief as possible, and often we let a chart speak for itself.
SIGNALS: Here we include the current day's signal table, an excerpt from the DecisionPoint Alert Daily Report.
DECISIONPOINT ALERT DAILY REPORT
Friday, 12/12/2014

************************ DECISIONPOINT MARKET POSTURE ***********************

The following is the market posture suggested by our mechanical trend-
following tools. These are not trading recommendations, rather they are price
activity flags that should be qualified by chart analysis. The Trend Model is
used on all indexes.


                                     Days   Index     12/12   Points  Percent
Index               Posture     Date Elap  @Start     Close      P/L      P/L
------------------- ------- -------- ---- -------   -------  -------  -------
Stocks Medium-Term  Bullish 10/31/14   42   201.66   200.89    -0.77    -0.4%
Stocks Long-Term    Bullish 10/31/14   42   201.66   200.89    -0.77    -0.4%
Gold (NY Spot)      Bearish 08/21/14  113  1275.40  1222.50   +52.90    +4.1%
20+Yr T-Bond  (TLT) Bullish 01/17/14  329   102.65   126.30   +23.65   +23.0%
------------------- ------- -------- ---- -------   -------  -------  -------
Dollar Index  (UUP) Bullish 07/21/14  144    21.47    23.43    +1.96    +9.1%
Commodities   (GSG) Neutral 07/14/14  151    32.64    22.82     ....     ....
Crude Oil     (USO) Neutral 07/30/14  135    36.92    21.93     ....     ....
------------------- ------- -------- ---- -------   -------  -------  -------
S&P 500       (SPY)     BUY 10/31/14   42   201.66   200.89    -0.77    -0.4%
S&P Equal Wt  (RSP)     BUY 11/03/14   39    78.10    77.76    -0.34    -0.4%
Dow           (DIA)     BUY 10/31/14   42   173.01   173.00    -0.01    -0.0%
Nasdaq 100    (QQQ)     BUY 10/29/14   44    99.81   102.71    +2.90    +2.9%
NDX Equal Wt (QQEW)     BUY 10/30/14   43    40.66    42.16    +1.50    +3.7%
S&P 100       (OEF)     BUY 10/31/14   42    89.75    89.13    -0.62    -0.7%
S&P 400 MidCp (IJH)     BUY 11/05/14   37   141.76   140.25    -1.51    -1.1%
S&P 600 SmlCp (IJR)     BUY 11/03/14   39   111.40   109.24    -2.16    -1.9%
Total Market  (VTI)     BUY 11/03/14   39   104.08   103.34    -0.74    -0.7%
Consumer Disc (XLY)     BUY 11/05/14   37    67.55    70.00    +2.45    +3.6%
Cons Disc EWt (RCD)     BUY 11/03/14   39    82.86    85.71    +2.85    +3.4%
Consumer Stpl (XLP)     BUY 08/20/14  114    44.59    47.91    +3.32    +7.4%
Cons Stpl EWt (RHS)     BUY 10/21/14   52    98.15   103.02    +4.87    +5.0%
Energy        (XLE) Neutral 09/08/14   95    95.08    74.02     ....     ....
Energy EWt    (RYE) Neutral 09/08/14   95    87.04    63.36     ....     ....
Financial     (XLF)     BUY 10/29/14   44    23.44    24.14    +0.70    +3.0%
Financial EWt (RYF)     BUY 10/30/14   43    42.64    43.55    +0.91    +2.1%
Health Care   (XLV)     BUY 10/23/14   50    64.31    68.78    +4.47    +7.0%
Health Cr EWt (RYH)     BUY 05/09/14  217   115.95   141.05   +25.10   +21.6%
Industrial    (XLI)     BUY 10/30/14   43    54.67    54.82    +0.15    +0.3%
Industrl EWt  (RGI)     BUY 10/31/14   42    87.96    86.88    -1.08    -1.2%
Materials     (XLB)     BUY 11/18/14   24    49.87    46.80    -3.07    -6.2%
Materials EWt (RTM)     BUY 11/17/14   25    84.00    81.02    -2.98    -3.5%
Technology    (XLK)     BUY 10/31/14   42    40.54    40.62    +0.08    +0.2%
Technolgy EWt (RYT)     BUY 11/04/14   38    87.51    88.60    +1.09    +1.2%
Utilities     (XLU)     BUY 08/28/14  106    42.62    45.91    +3.29    +7.7%
Utilities EWt (RYU)     BUY 08/20/14  114    71.92    76.14    +4.22    +5.9%

Average                                59                               +2.4%
NOTE: Mechanical trading model signals define the implied bias of the price index based upon moving average relationships, but they do not necessarily call for a specific action. They are information flags that should prompt chart review. Further, they do not call for continuous buying or selling during the life of the signal. For example, a BUY signal will probably return the best results if action is taken soon after the signal is generated. Additional opportunities for buying may be found as price zigzags higher, but the trader must look for optimum entry points. Conversely, exit points to preserve gains (or minimize losses) may be evident before the model mechanically closes the signal.
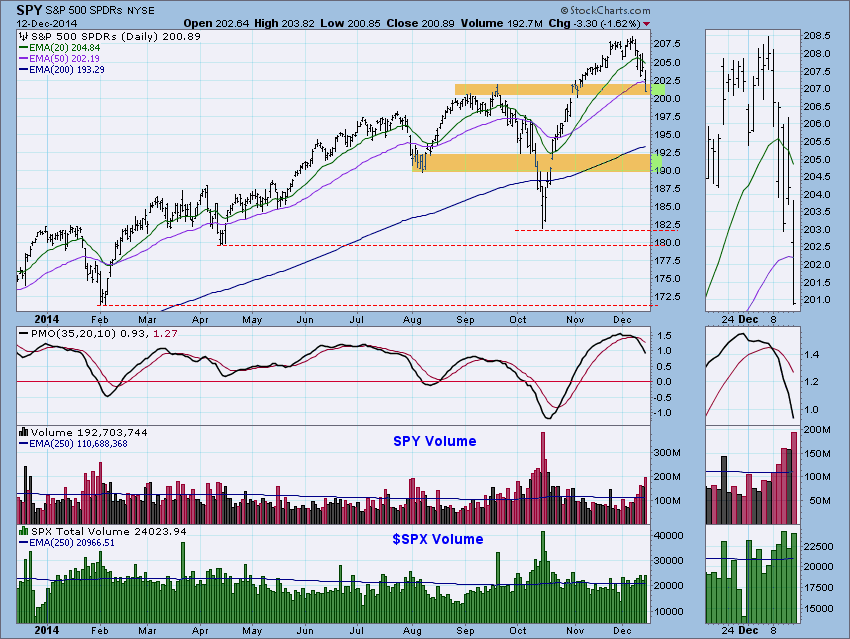
STOCKS: Based upon a 10/31/2014 Trend Model BUY signal, our current intermediate-term market posture for the S&P 500 (SPY) is bullish. The Trend Model, which informs our long-term outlook, is on a BUY signal as of 10/31/2014 so our long-term posture is bullish.
SPY is near the bottom of a zone of support. The next area of support is associated with some congestion in August, and the gap in October.
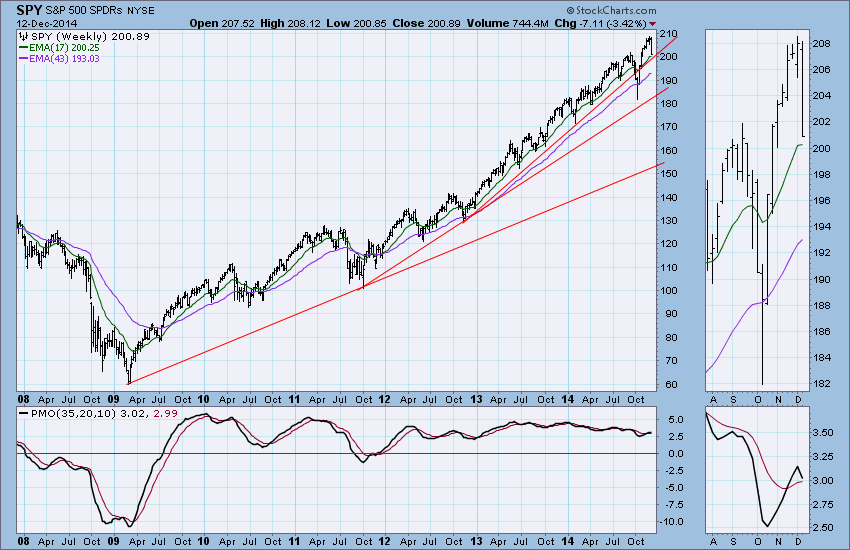
The nearest rising bottoms line on the weekly chart was penetrated in October, but it has since been recaptured. We think it has some relevance as to where support might be found.
Ultra-Short-Term Indicators: The CVI and Participation Indexes confirmed today's price action by exceeding Wednesday's climaxes; however, the net breadth and volume contracted somewhat, showing that internal pressure is abating.
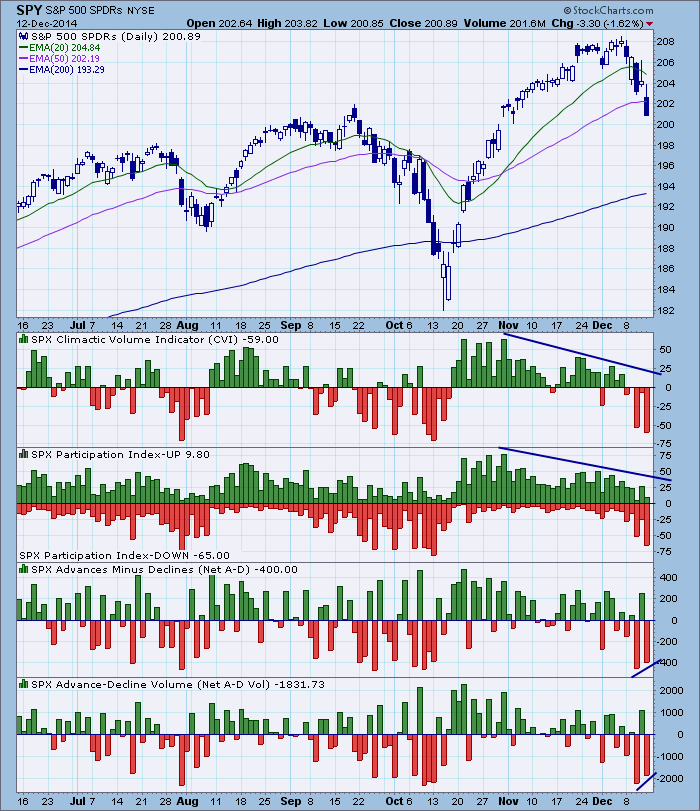
Short-Term Indicators: These indicators are getting oversold, but we decided to switch from a one-year to a three-year time frame to show that they are not that oversold in relation to the longer-term range.
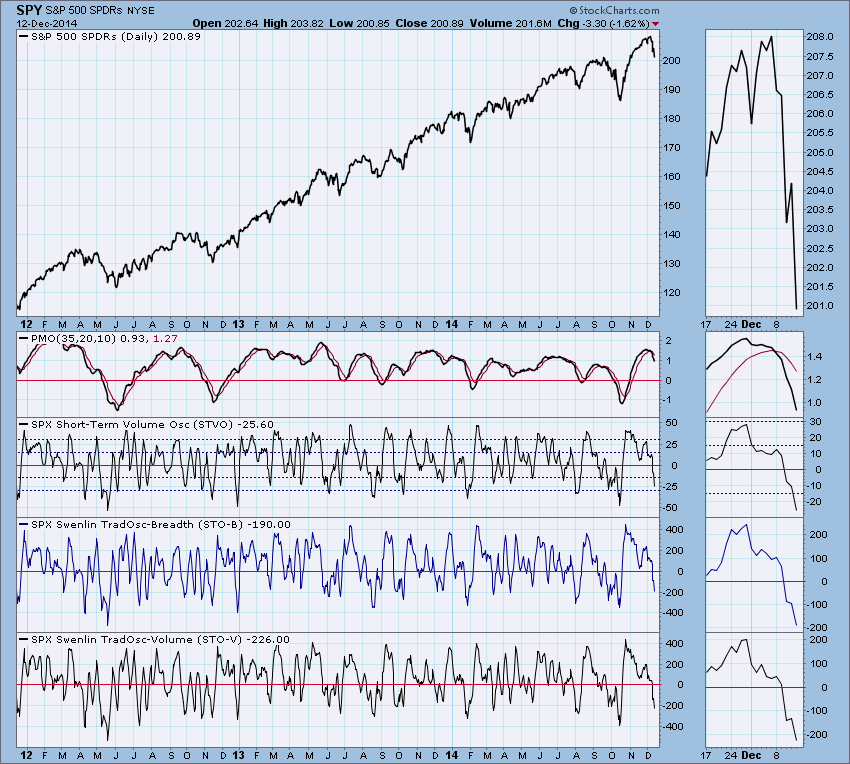
Intermediate-Term Indicators: When we see these indicators top at overbought levels, we anticipate (sometimes incorrectly) that prices will fall until the indicators are oversold. In spite of the October decline, we still think a good selloff is well deserved.
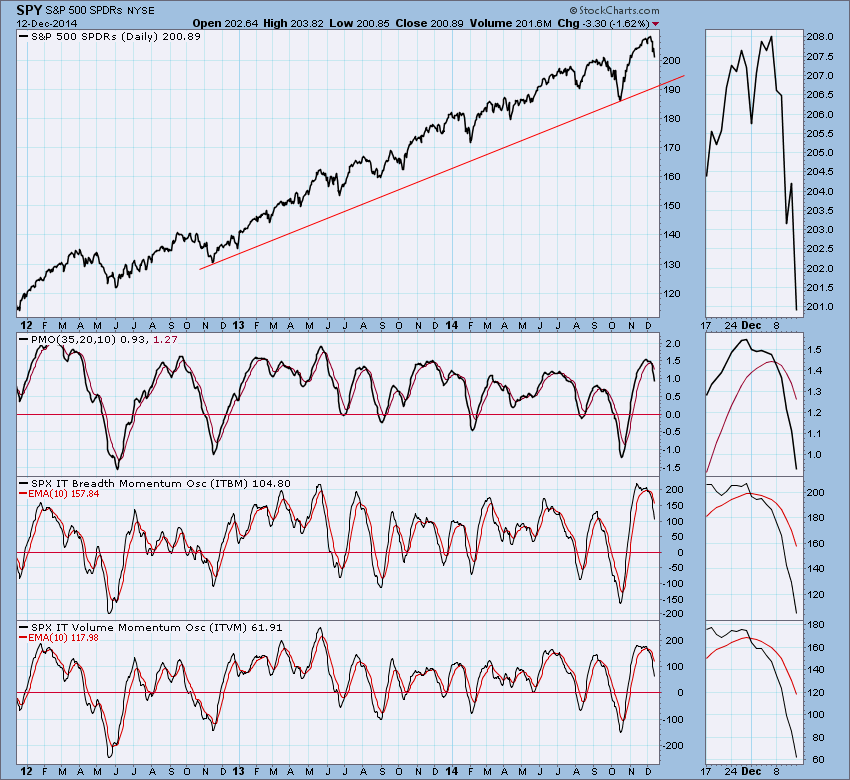
Conclusion: The ultra-short-term indicators climaxed on Friday, so a small bounce or consolidation is possible; however, we are interpreting the climaxes as being initiation climaxes that signal more downside action. Intermediate-term indicators are looking pretty much like textbook examples of what happens at important price tops. The S&P 500 Index P/E is 19.4, which is at the overvalued side of the normal 10 to 20 range, so the market is not only overbought, it is also overvalued.
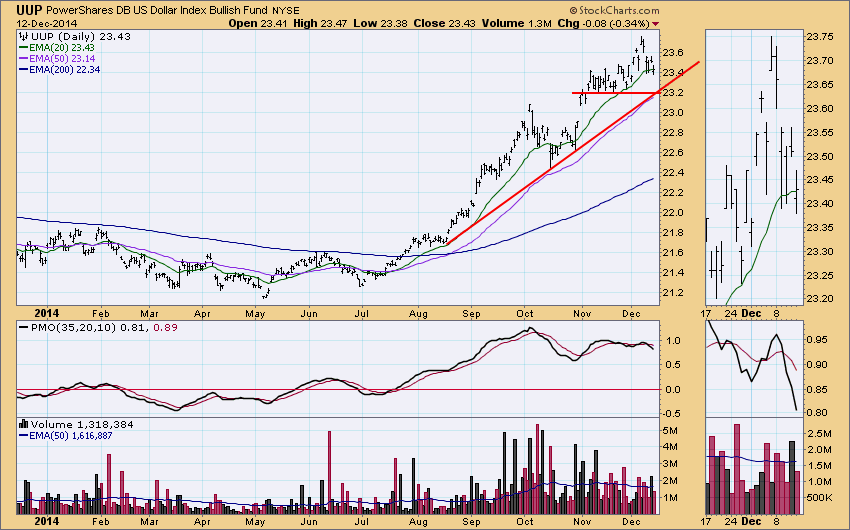
DOLLAR: As of 7/21/2014 the US Dollar Index ETF (UUP) is on a Trend Model BUY signal. The LT Trend Model, which informs our long-term outlook, is on a BUY signal as of 8/21/2014, so our long-term posture is bullish.
UUP has been falling away from a recent high.
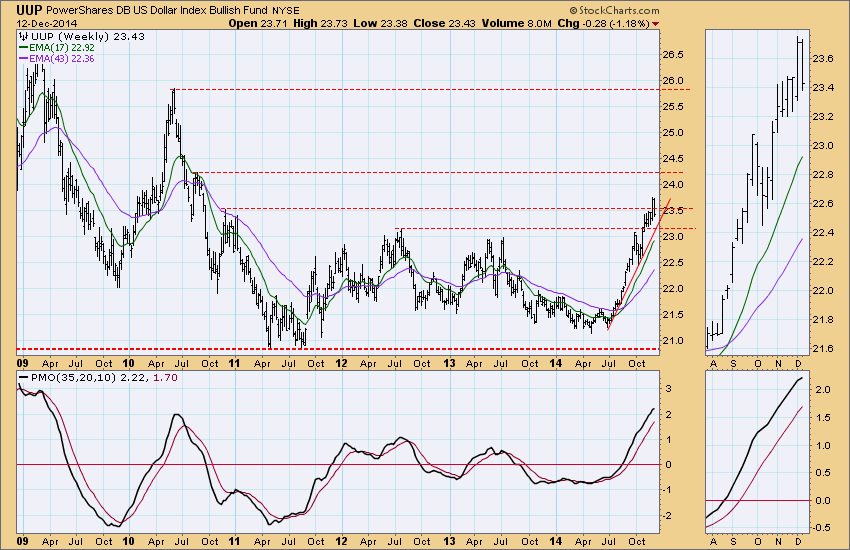
The weekly chart shows that the drop has taken UUP back below an horizontal support line, but more significant, we think, is that the rising trend line supporting the advance.
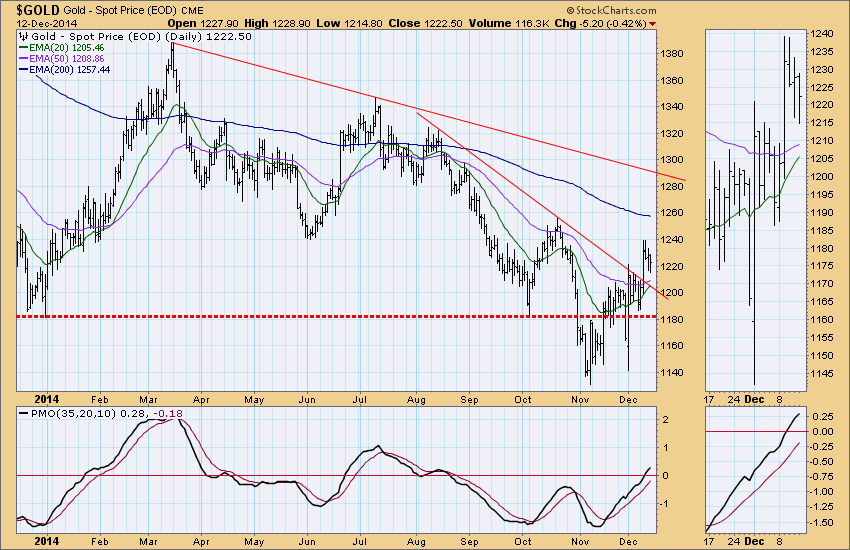
GOLD: As of 8/21/2014 Gold is on a Trend Model SELL signal. The LT Trend Model, which informs our long-term outlook, is on a SELL signal as of 2/15/2013, so our long-term posture is bearish.
After dropping below important support, gold rallied back above it. Gold has also recently broken above a declining tops line.
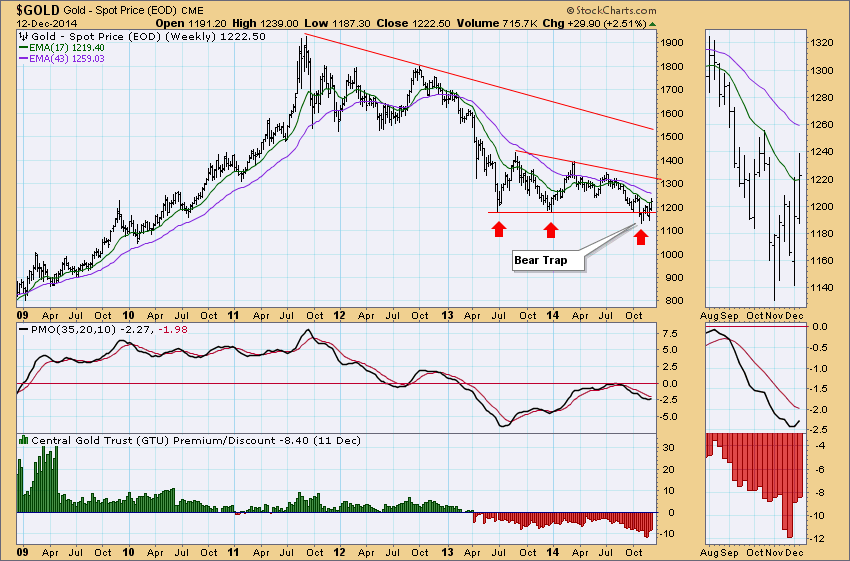
The weekly chart shows the bear trap and suggests the bullish dynamics of a triple bottom.
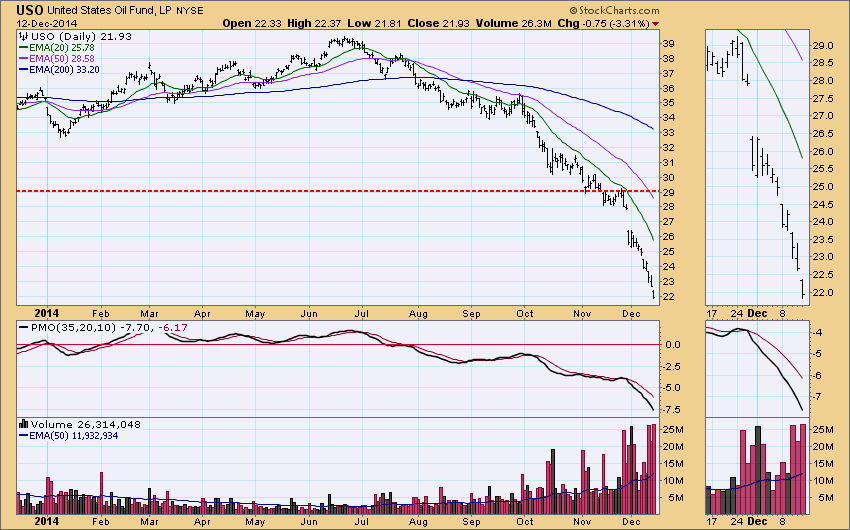
CRUDE OIL (USO): As of 7/30/2014 United States Oil Fund (USO) is on a Trend Model NEUTRAL signal. The LT Trend Model, which informs our long-term outlook, is on a SELL signal as of 8/28/2014, so our long-term posture is bearish.
USO has been accelerating downward, as crude seems to have no bottom near.
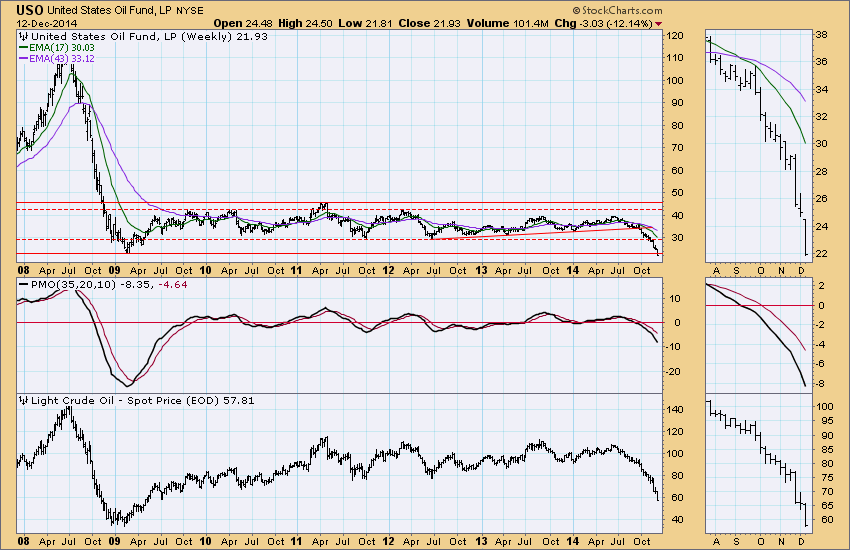
The weekly chart gives the best perspective, where we see that the 2009 low was taken out this week. The bottom panel on the chart is $WTIC (the raw futures contract price), which is still about $30 above the 2009 low of $35/barrel. The reason for the difference between the two is that price of the ETF reflects the actual cost of trading the futures contracts.
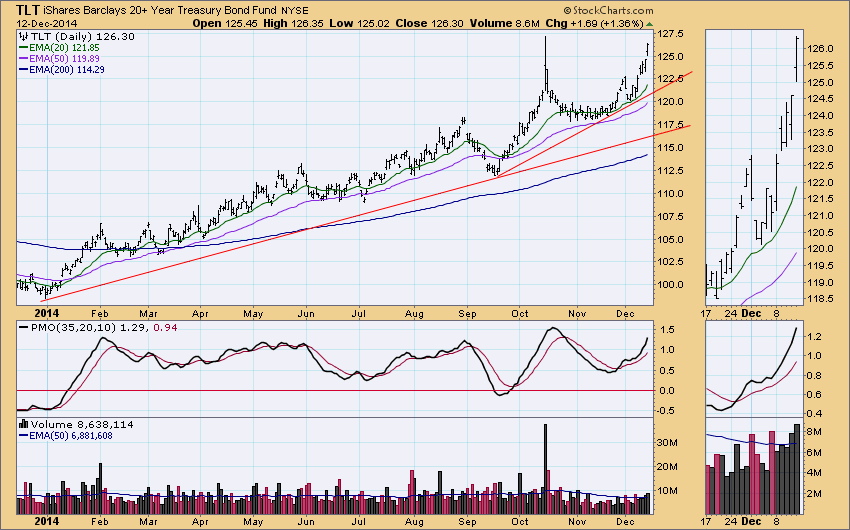
BONDS (TLT): As of 1/17/2014 The 20+ Year T-Bonds ETF (TLT) is on a Trend Model BUY signal. The LT Trend Model, which informs our long-term outlook, is on a BUY signal as of 3/24/2014, so our long-term posture is bullish.
The current advance toward new highs seems to be more solid than the one-day spike in October.
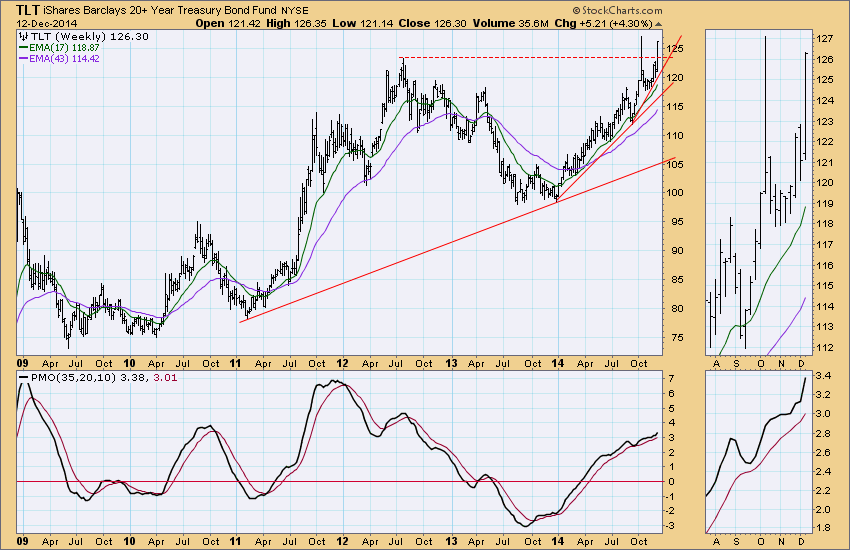
And this time TLT has managed to close above the resistance line drawn across the 2012 top.
Technical Analysis is a windsock, not a crystal ball.
- Carl


