**Please note the new DecisionPoint Blog publishing schedule. The Friday DP Weekly Update will only be available in the Subscriber-only DP Reports Blog starting next week.**
Join me Wednesday for the first DecisionPoint LIVE! Webinar at 4:30pm Eastern. Click here to register!
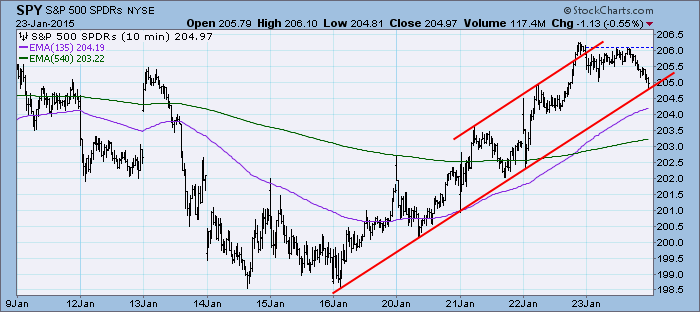
Price took a pause and moved back down to the support line drawn from last Friday's low. That support held which is good news, however, the day ended right when it reached that support line so tomorrow it will actually test it.
The purpose of the DecisionPoint Daily Update is to quickly review the day's action, internal condition, and Trend Model status of the broad market (S&P 500), the nine SPDR Sectors, the U.S. Dollar, Gold, Crude Oil, and Bonds. To ensure that using this daily reference will be quick and painless, we are as brief as possible, and often we let a chart speak for itself.
SIGNALS: Here we include the current day's signal table, an excerpt from the DecisionPoint Alert Daily Report.
DECISIONPOINT ALERT DAILY REPORT
Friday, 1/23/2015

************************ DECISIONPOINT MARKET POSTURE ***********************

The following is the market posture suggested by our mechanical trend-
following tools. These are not trading recommendations, rather they are price
activity flags that should be qualified by chart analysis. The Trend Model is
used on all indexes.


                                     Days   Index     01/23   Points  Percent
Index               Posture     Date Elap  @Start     Close      P/L      P/L
------------------- ------- -------- ---- -------   -------  -------  -------
Stocks Medium-Term  Bullish 10/31/14   84   200.55   204.97    +4.42    +2.2%
Stocks Long-Term    Bullish 10/31/14   84   200.55   204.97    +4.42    +2.2%
Gold (NY Spot)      Bullish 01/12/15   11  1233.40  1292.60   +59.20    +4.8%
20+Yr T-Bond  (TLT) Bullish 01/17/14  371   102.43   134.77   +32.34   +31.6%
------------------- ------- -------- ---- -------   -------  -------  -------
Dollar Index  (UUP) Bullish 07/21/14  186    21.47    25.21    +3.74   +17.4%
Commodities   (GSG) Neutral 07/14/14  193    32.64    19.19     ....     ....
Crude Oil     (USO) Neutral 07/30/14  177    36.92    17.00     ....     ....
------------------- ------- -------- ---- -------   -------  -------  -------
S&P 500       (SPY)     BUY 10/31/14   84   200.55   204.97    +4.42    +2.2%
S&P Equal Wt  (RSP)     BUY 11/03/14   81    77.77    79.44    +1.67    +2.1%
Dow           (DIA)     BUY 10/31/14   84   172.49   176.41    +3.92    +2.3%
Nasdaq 100    (QQQ)     BUY 10/29/14   86    99.44   104.26    +4.82    +4.8%
NDX Equal Wt (QQEW)     BUY 10/30/14   85    40.52    42.73    +2.21    +5.5%
S&P 100       (OEF)     BUY 10/31/14   84    88.84    90.50    +1.66    +1.9%
S&P 400 MidCp (IJH)     BUY 11/05/14   79   141.11   145.19    +4.08    +2.9%
S&P 600 SmlCp (IJR)     BUY 11/03/14   81   110.95   112.26    +1.31    +1.2%
Total Market  (VTI)     BUY 11/03/14   81   103.53   105.75    +2.22    +2.1%
Consumer Disc (XLY)     BUY 11/05/14   79    67.27    70.93    +3.66    +5.4%
Cons Disc EWt (RCD)     BUY 11/03/14   81    82.65    86.78    +4.13    +5.0%
Consumer Stpl (XLP)     BUY 08/20/14  156    44.27    49.65    +5.38   +12.2%
Cons Stpl EWt (RHS)     BUY 10/21/14   94    97.79   107.19    +9.40    +9.6%
Energy        (XLE) Neutral 09/08/14  137    94.49    76.66     ....     ....
Energy EWt    (RYE) Neutral 09/08/14  137    86.56    64.48     ....     ....
Financial     (XLF) Neutral 01/20/15    3    23.39    23.77     ....     ....
Financial EWt (RYF)     BUY 10/30/14   85    42.45    43.85    +1.40    +3.3%
Health Care   (XLV)     BUY 10/23/14   92    64.07    70.94    +6.87   +10.7%
Health Cr EWt (RYH)     BUY 05/09/14  259   115.84   146.80   +30.96   +26.7%
Industrial    (XLI)     BUY 10/30/14   85    54.37    55.99    +1.62    +3.0%
Industrl EWt  (RGI) Neutral 01/20/15    3    86.93    88.52     ....     ....
Materials     (XLB) Neutral 01/06/15   17    46.99    48.25     ....     ....
Materials EWt (RTM)     BUY 01/23/15    0    83.59    83.59 * Changed Today *
Technology    (XLK)     BUY 10/31/14   84    40.33    41.45    +1.12    +2.8%
Technolgy EWt (RYT)     BUY 11/04/14   80    87.04    89.94    +2.90    +3.3%
Utilities     (XLU)     BUY 08/28/14  148    42.24    49.14    +6.90   +16.3%
Utilities EWt (RYU)     BUY 08/20/14  156    71.41    81.17    +9.76   +13.7%

Average                                90                               +6.5%
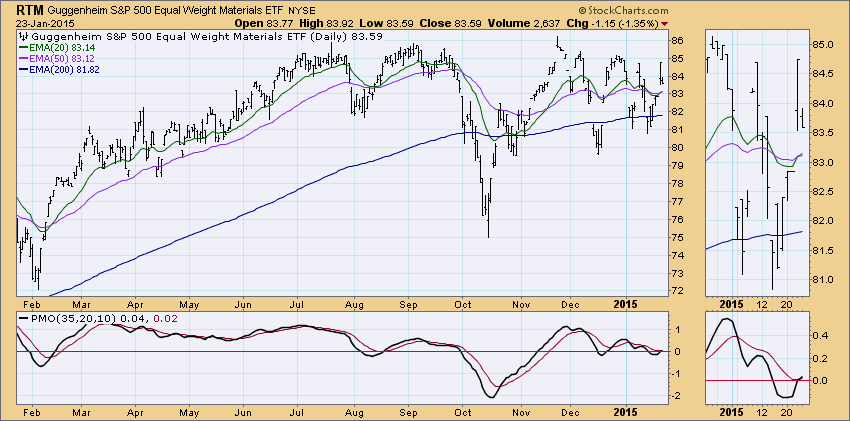
RTM had a whipsaw Trend Model signal change to a BUY today after switching to Neutral last week. The Trend Model is vulnerable to another whipsaw change because the 20-EMA is so close to the 50-EMA. Given that the PMO had a positive crossover its EMA today, this BUY signal has some potential.
NOTE: Mechanical trading model signals define the implied bias of the price index based upon moving average relationships, but they do not necessarily call for a specific action. They are information flags that should prompt chart review. Further, they do not call for continuous buying or selling during the life of the signal. For example, a BUY signal will probably return the best results if action is taken soon after the signal is generated. Additional opportunities for buying may be found as price zigzags higher, but the trader must look for optimum entry points. Conversely, exit points to preserve gains (or minimize losses) may be evident before the model mechanically closes the signal.
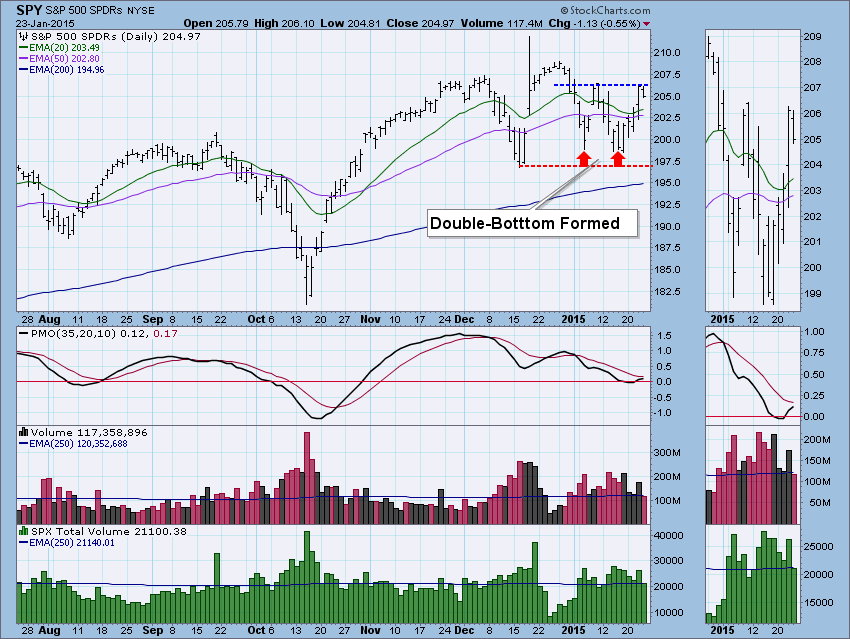
STOCKS: Based upon a 10/31/2014 Trend Model BUY signal, our current intermediate-term market posture for the S&P 500 (SPY) is bullish. The Trend Model, which informs our long-term outlook, is on a BUY signal as of 10/31/2014 so our long-term posture is bullish.
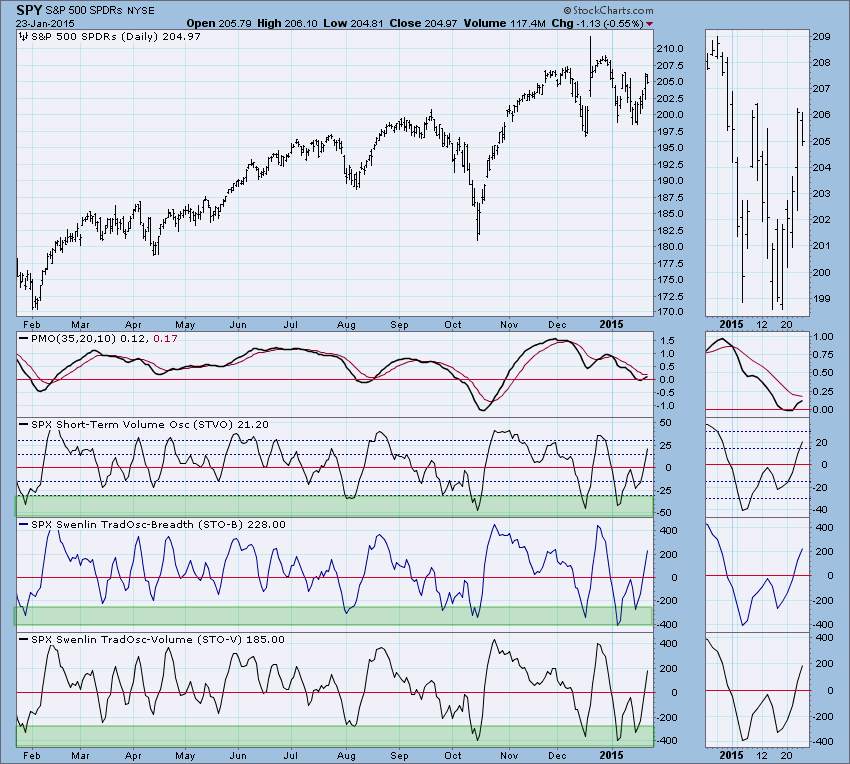
We are keeping an eye on the short-term double-bottom formation on the SPY. Interestingly, today's high tested the overhead resistance at the blue neckline. For this pattern to execute, price needs to penetrate the neckline significantly. Although it was a negative day, it is good news that volume was low. The PMO slowed slightly but still appears it will make a positive crossover next week.
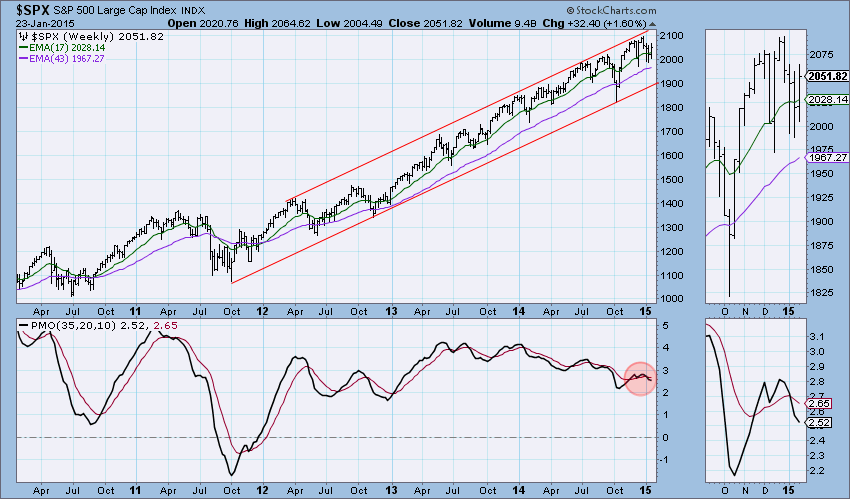
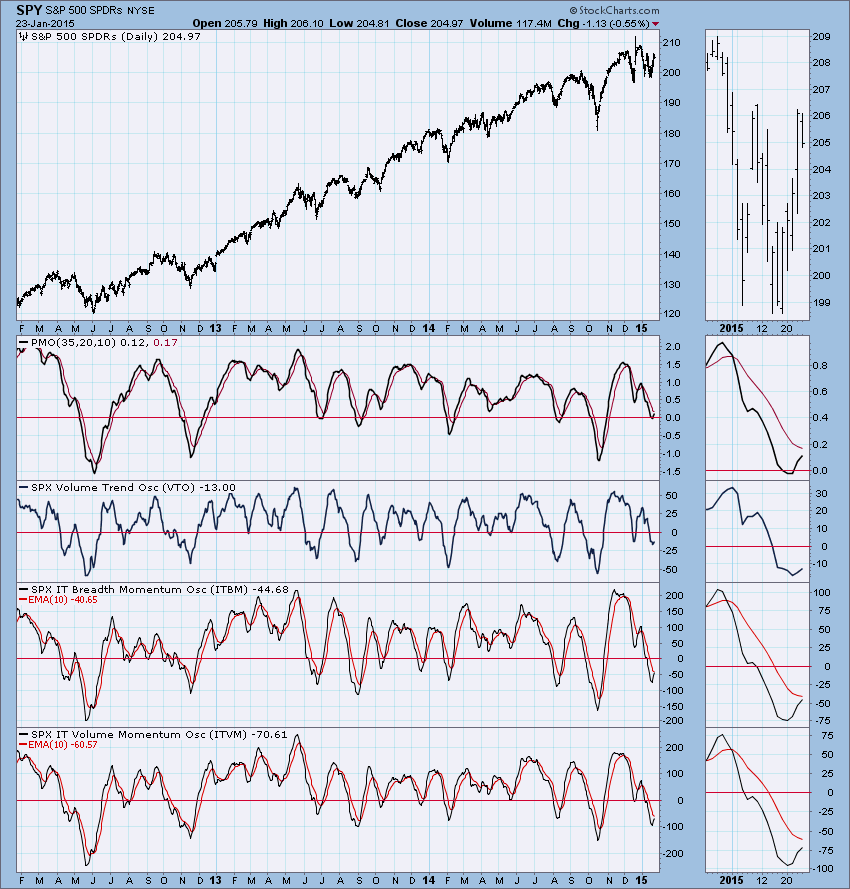
Looking at the weekly picture, we see that the weekly PMO is still in decline and it is a long way down should price begin a serious correction. The last two corrections were barely noticeable.
Ultra-Short-Term Indicators: These indicators are neutral today, no significant spikes. Yesterday, we determined there was an initiation impulse as readings spiked. An initiation impulse tells us to expect higher prices in the next few days.
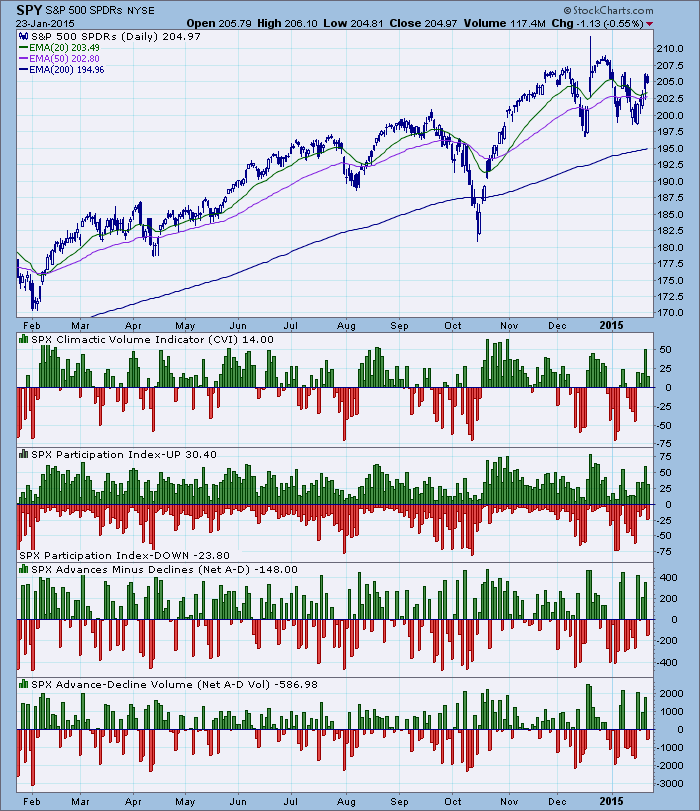
Short-Term Indicators: All of these indicators are looking good. They are beginning to get overbought, but the ceiling is still fairly far away.
Intermediate-Term Indicators: The ITBM and ITVM are approaching a positive crossover which would be very bullish. They are rising and weren't put off by today's decline which is bullish.
Conclusion: Today the market paused and was unable to penetrate the neckline of the double-bottom formation. This bullish pattern is still very much intact and short- and intermediate-term indicators are all bullish. The charts tell us to expect a breakout above the neckline. If that were to happen the pattern would execute and we would be looking at a minimum upside target around 214 on the SPY.
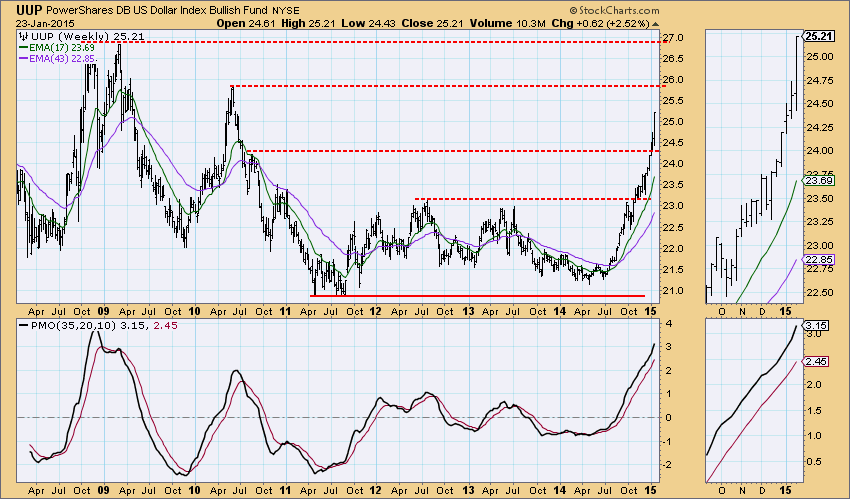
DOLLAR: As of 7/21/2014 the US Dollar Index ETF (UUP) is on a Trend Model BUY signal. The LT Trend Model, which informs our long-term outlook, is on a BUY signal as of 8/21/2014, so our long-term posture is bullish.
The dollar shot higher this week and is making a real run at overhead resistance at the 2010 high. The PMO has not hesitated in its meteoric rise so it seems likely it will ultimately test that resistance.
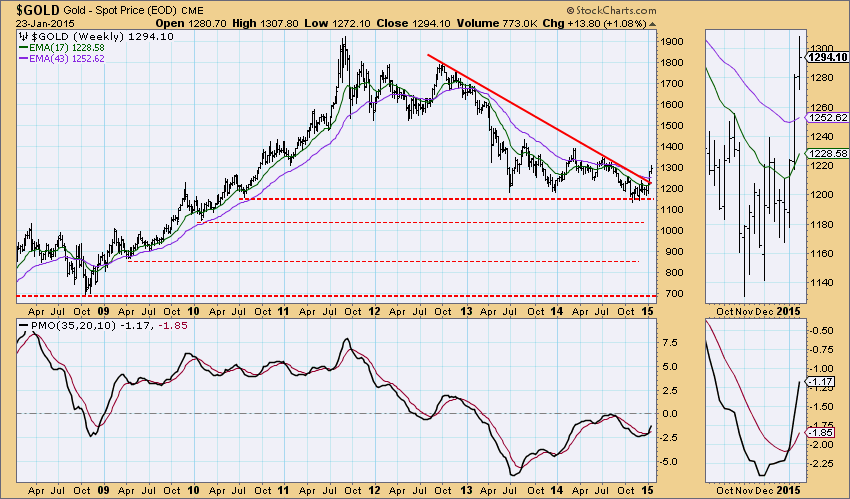
GOLD: As of 1/12/2015 Gold is on a Trend Model BUY signal. The LT Trend Model, which informs our long-term outlook, is on a SELL signal as of 2/15/2013, so our long-term posture is bearish.
Gold has had a very nice rally the past three weeks despite a strong dollar. The threshold must have been met for investors when price reached just below the 2013 lows. The PMO is very healthy, but we'd definitely like to see it get past the zero line.
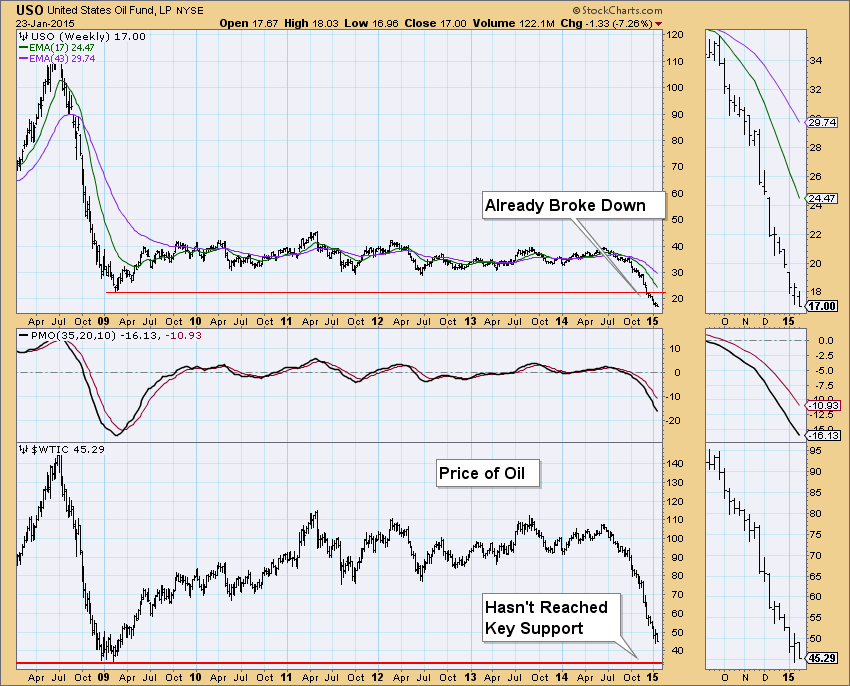
CRUDE OIL (USO): As of 7/30/2014 United States Oil Fund (USO) is on a Trend Model NEUTRAL signal. The LT Trend Model, which informs our long-term outlook, is on a SELL signal as of 8/28/2014, so our long-term posture is bearish.
USO broke down below its 2009 low last month, but notice the price of oil has not yet tested support at its 2009 low. I wouldn't expect USO to make the turn until Oil tests support or breaks out of the declining trend it has been in since July.
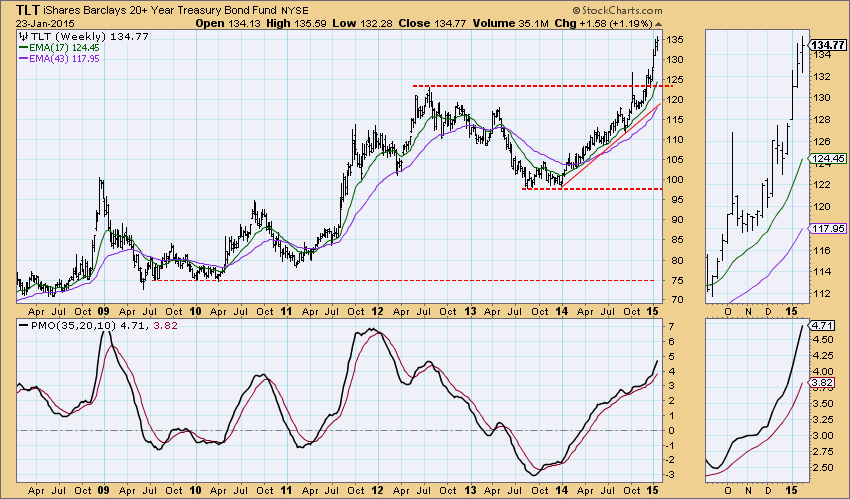
BONDS (TLT): As of 1/17/2014 The 20+ Year T-Bonds ETF (TLT) is on a Trend Model BUY signal. The LT Trend Model, which informs our long-term outlook, is on a BUY signal as of 3/24/2014, so our long-term posture is bullish.
Bonds have also enjoyed a long rally similar to the dollar's. I notice that we could be seeing a small flag forming. The concern is whether TLT can maintain such a steep rising trend, the PMO seems to think it can as it takes a rising strongly. Also good for TLT is that the PMO is only somewhat overbought right now.
Technical Analysis is a windsock, not a crystal ball.
Happy Charting!
- Erin


