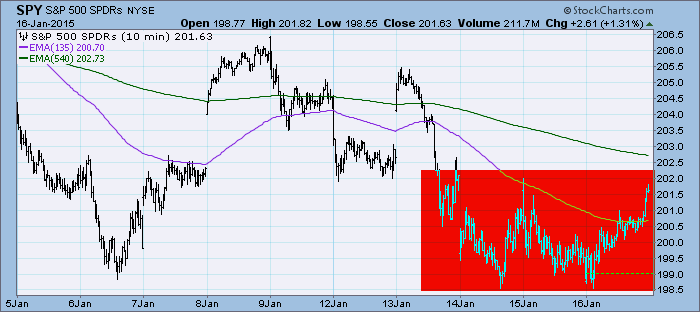
Price took a break from decline and spent the day climbing. For the past three days, the 10-minute bar chart shows price is trading in a range of possible consolidation. Let's look at the indicators to find out where they are suggesting the market will be heading.
The purpose of the DecisionPoint Daily Update is to quickly review the day's action, internal condition, and Trend Model status of the broad market (S&P 500), the nine SPDR Sectors, the U.S. Dollar, Gold, Crude Oil, and Bonds. To ensure that using this daily reference will be quick and painless, we are as brief as possible, and often we let a chart speak for itself.
SIGNALS: Here we include the current day's signal table, an excerpt from the DecisionPoint Alert Daily Report.
DECISIONPOINT ALERT DAILY REPORT
Friday, 1/16/2015

************************ DECISIONPOINT MARKET POSTURE ***********************

The following is the market posture suggested by our mechanical trend-
following tools. These are not trading recommendations, rather they are price
activity flags that should be qualified by chart analysis. The Trend Model is
used on all indexes.


                                     Days   Index     01/16   Points  Percent
Index               Posture     Date Elap  @Start     Close      P/L      P/L
------------------- ------- -------- ---- -------   -------  -------  -------
Stocks Medium-Term  Bullish 10/31/14   77   200.55   201.63    +1.08    +0.5%
Stocks Long-Term    Bullish 10/31/14   77   200.55   201.63    +1.08    +0.5%
Gold (NY Spot)      Bullish 01/12/15    4  1233.40  1276.90   +43.50    +3.5%
20+Yr T-Bond  (TLT) Bullish 01/17/14  364   102.43   133.19   +30.76   +30.0%
------------------- ------- -------- ---- -------   -------  -------  -------
Dollar Index  (UUP) Bullish 07/21/14  179    21.47    24.59    +3.12   +14.5%
Commodities   (GSG) Neutral 07/14/14  186    32.64    19.82     ....     ....
Crude Oil     (USO) Neutral 07/30/14  170    36.92    18.33     ....     ....
------------------- ------- -------- ---- -------   -------  -------  -------
S&P 500       (SPY)     BUY 10/31/14   77   200.55   201.63    +1.08    +0.5%
S&P Equal Wt  (RSP)     BUY 11/03/14   74    77.77    78.19    +0.42    +0.5%
Dow           (DIA)     BUY 10/31/14   77   172.49   174.67    +2.18    +1.3%
Nasdaq 100    (QQQ)     BUY 10/29/14   79    99.44   100.82    +1.38    +1.4%
NDX Equal Wt (QQEW)     BUY 10/30/14   78    40.52    41.72    +1.20    +3.0%
S&P 100       (OEF)     BUY 10/31/14   77    88.84    89.06    +0.22    +0.2%
S&P 400 MidCp (IJH)     BUY 11/05/14   72   141.11   142.62    +1.51    +1.1%
S&P 600 SmlCp (IJR)     BUY 11/03/14   74   110.95   111.17    +0.22    +0.2%
Total Market  (VTI)     BUY 11/03/14   74   103.53   104.02    +0.49    +0.5%
Consumer Disc (XLY)     BUY 11/05/14   72    67.27    69.67    +2.40    +3.6%
Cons Disc EWt (RCD)     BUY 11/03/14   74    82.65    84.89    +2.24    +2.7%
Consumer Stpl (XLP)     BUY 08/20/14  149    44.27    49.27    +5.00   +11.3%
Cons Stpl EWt (RHS)     BUY 10/21/14   87    97.79   106.03    +8.24    +8.4%
Energy        (XLE) Neutral 09/08/14  130    94.49    75.23     ....     ....
Energy EWt    (RYE) Neutral 09/08/14  130    86.56    63.18     ....     ....
Financial     (XLF)     BUY 10/29/14   79    23.32    23.49    +0.17    +0.7%
Financial EWt (RYF)     BUY 10/30/14   78    42.45    43.35    +0.90    +2.1%
Health Care   (XLV)     BUY 10/23/14   85    64.07    70.37    +6.30    +9.8%
Health Cr EWt (RYH)     BUY 05/09/14  252   115.84   145.34   +29.50   +25.5%
Industrial    (XLI)     BUY 10/30/14   78    54.37    54.73    +0.36    +0.7%
Industrl EWt  (RGI)     BUY 10/31/14   77    87.54    86.48    -1.06    -1.2%
Materials     (XLB) Neutral 01/06/15   10    46.99    47.85     ....     ....
Materials EWt (RTM) Neutral 01/15/15    1    81.20    82.40     ....     ....
Technology    (XLK)     BUY 10/31/14   77    40.33    40.38    +0.05    +0.1%
Technolgy EWt (RYT)     BUY 11/04/14   73    87.04    88.03    +0.99    +1.1%
Utilities     (XLU)     BUY 08/28/14  141    42.24    48.62    +6.38   +15.1%
Utilities EWt (RYU)     BUY 08/20/14  149    71.41    80.58    +9.17   +12.8%

Average                                90                               +4.4%

NOTE: Mechanical trading model signals define the implied bias of the price index based upon moving average relationships, but they do not necessarily call for a specific action. They are information flags that should prompt chart review. Further, they do not call for continuous buying or selling during the life of the signal. For example, a BUY signal will probably return the best results if action is taken soon after the signal is generated. Additional opportunities for buying may be found as price zigzags higher, but the trader must look for optimum entry points. Conversely, exit points to preserve gains (or minimize losses) may be evident before the model mechanically closes the signal.
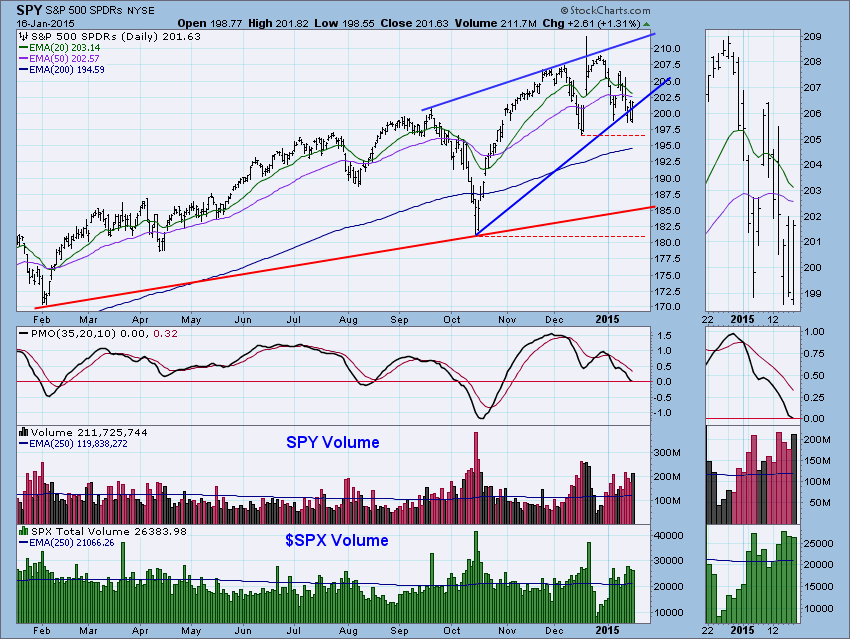
STOCKS: Based upon a 10/31/2014 Trend Model BUY signal, our current intermediate-term market posture for the S&P 500 (SPY) is bullish. The Trend Model, which informs our long-term outlook, is on a BUY signal as of 10/31/2014 so our long-term posture is bullish.
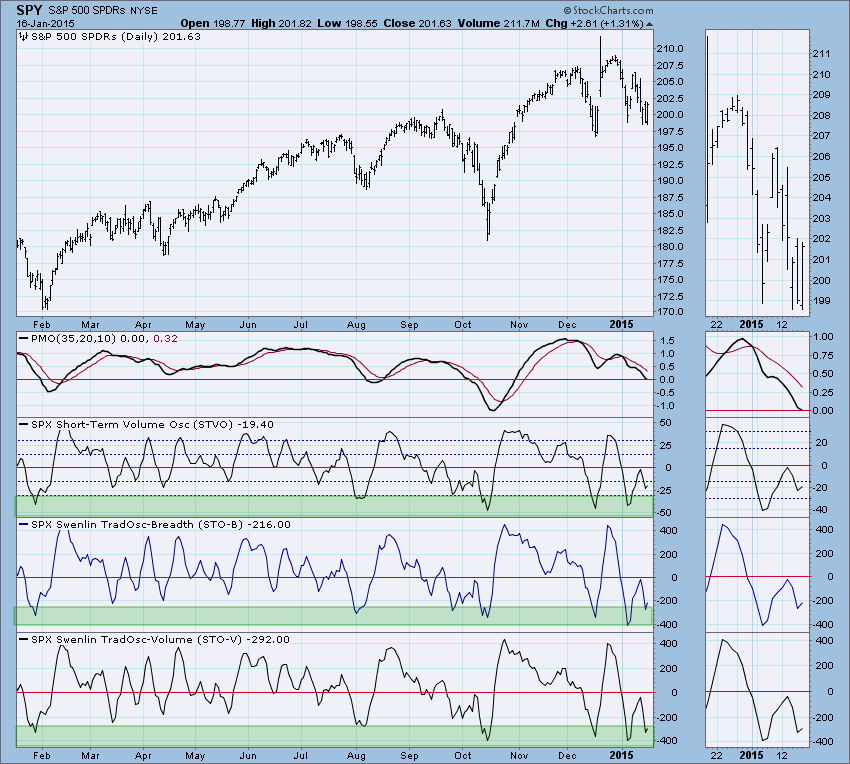
Today's price bar mimicked yesterday's which helped form this range of consolidation. The DecisionPoint Intermediate-Term Trend Model is now nearing a possible Neutral signal. This would occur if the 20-EMA crossed below the 50-EMA. A neutral signal means moving to cash or out of the market. A SELL signal will only generate if the 20/50-EMA negative crossover occurs while the 50-EMA is below the 200-EMA. The PMO was not impressed by today's rally and it continues lower which is bearish. It may be early, but I see a possible double-bottom shaping up, but that would require much higher prices. The indicators will tell us if this is probable or not.
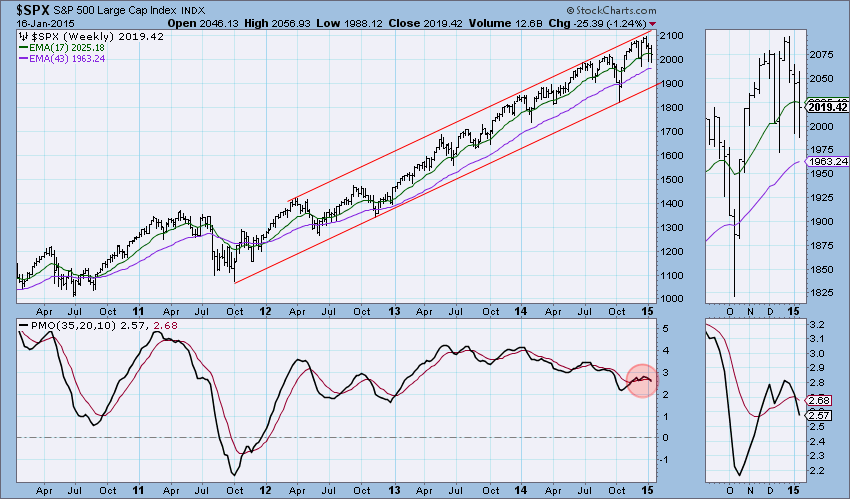
The weekly PMO had a negative crossover which is longer-term bearish. However, the PMO has been jerked around lately so I'd like to see some distance put between it and its EMA before reading it as especially negative. This chart mainly tells us there is room for price to move much lower before hitting long-term support.
Ultra-Short-Term Indicators: Breadth was naturally high to the positive side but the CVI and Participation Index didn't really spike given today's rally. I find this neutral to somewhat bearish.
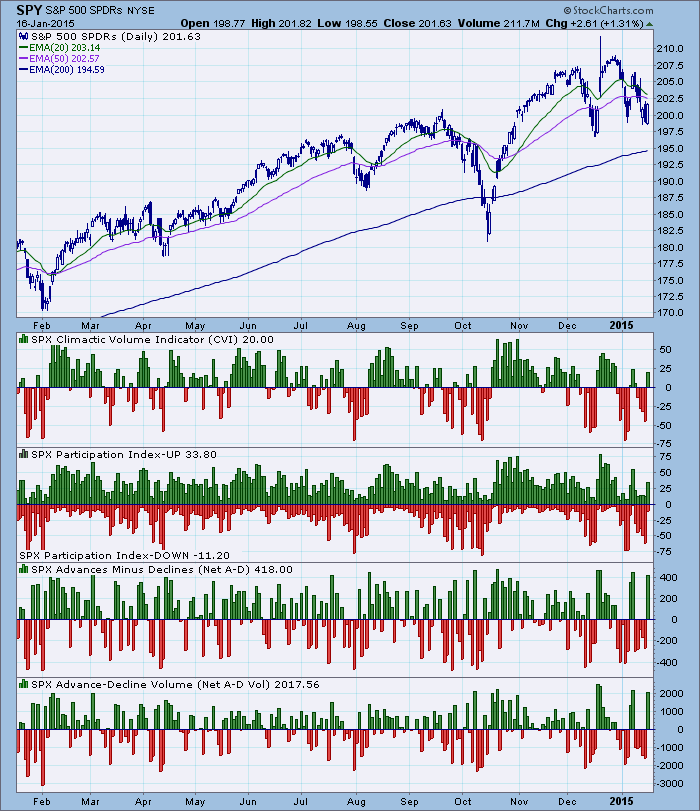
Short-Term Indicators: These indicators are the most bullish as they bottomed in oversold territory. They didn't move much in the positive direction, but a bottom is short-term bullish.
Intermediate-Term Indicators: The ITBM and ITVM have reached somewhat oversold territory but have yet to turn around which is bearish. They can move into much further oversold territory, but we've seen bottoms occur in this area before. Today's rally did seem to slow their descent which is positive.
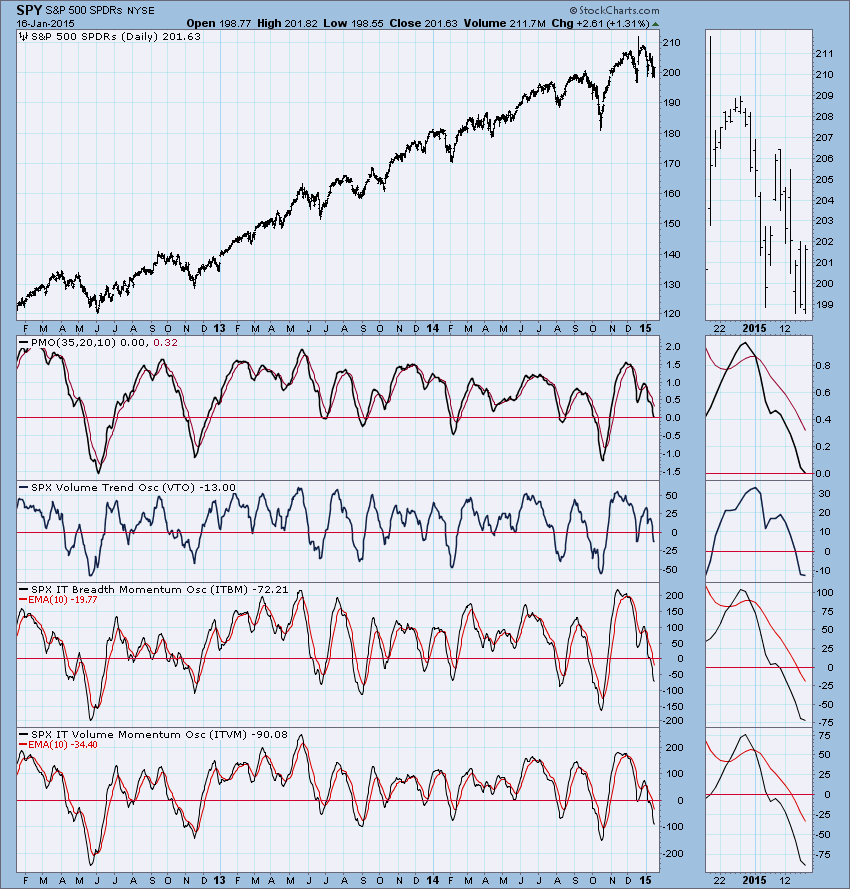
Conclusion: The indicators are somewhat contradictory, with short-term indicators being bullish and intermediate-term indicators declining and bearish. It does take the intermediate-term indicators time to react to a rally and this is only one day of rally. I can't get too bearish because there is a possible double-bottom forming in conjunction with bullish short-term indicator bottoms.
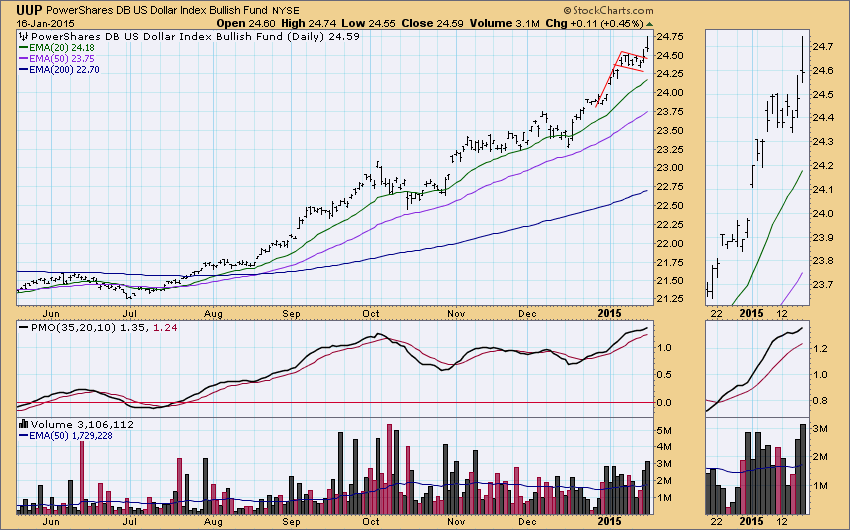
DOLLAR: As of 7/21/2014 the US Dollar Index ETF (UUP) is on a Trend Model BUY signal. The LT Trend Model, which informs our long-term outlook, is on a BUY signal as of 8/21/2014, so our long-term posture is bullish.
The bull flag executed yesterday and we saw good follow-through today. The minimum upside target would be around 25.15.
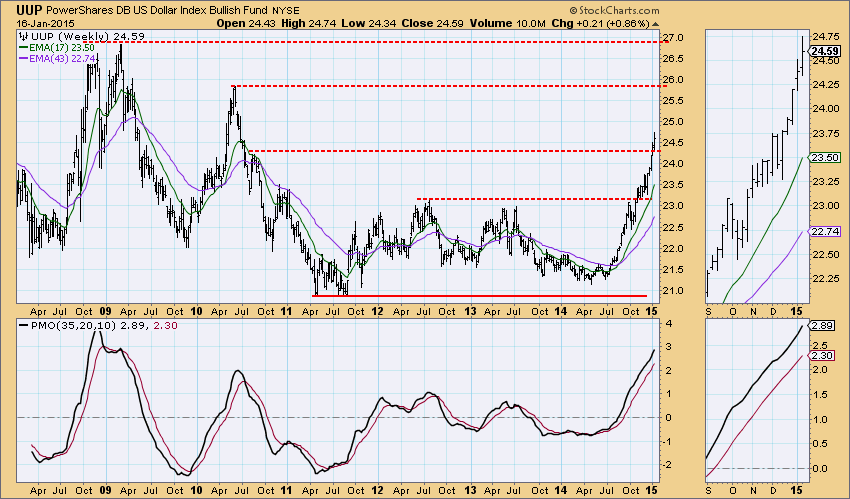
On the weekly chart we can see that even at 25.15 there isn't any long-term overhead resistance until 25.75. The weekly PMO is rising strongly and has overtaken all but one top, so it can certainly accommodate more rally.
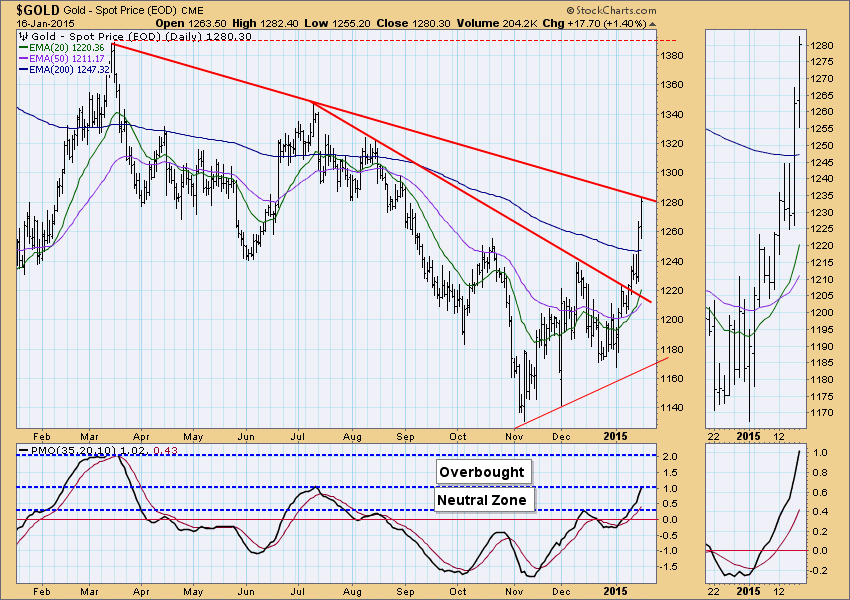
GOLD: As of 1/12/2015 Gold is on a Trend Model BUY signal. The LT Trend Model, which informs our long-term outlook, is on a SELL signal as of 2/15/2013, so our long-term posture is bearish.
Interestingly, the strong dollar is not affecting gold that adversely. Price hit medium-term resistance today. The PMO hasn't quite reached overbought territory so it would support higher prices.
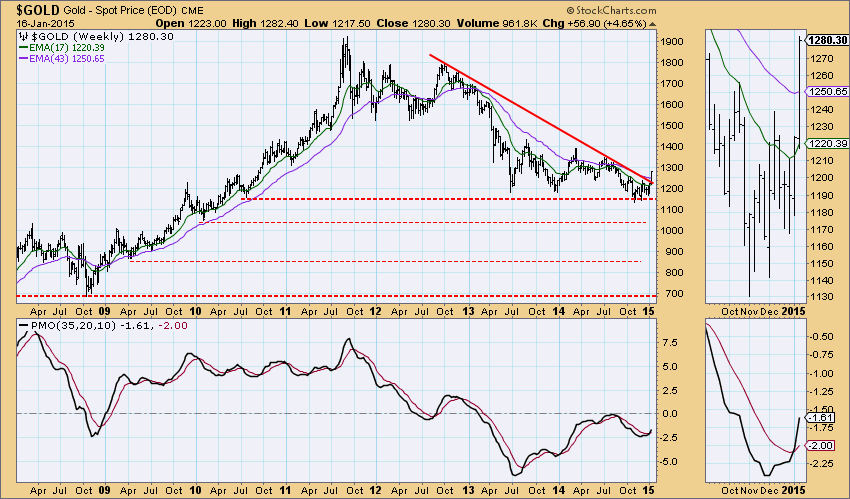
The weekly chart for gold shows a signficant breakout this week right after a weekly PMO BUY signal last week. The weekly picture is also bullish for gold. At this point, we look for price to break overhead resistance on the daily chart.
CRUDE OIL (USO): As of 7/30/2014 United States Oil Fund (USO) is on a Trend Model NEUTRAL signal. The LT Trend Model, which informs our long-term outlook, is on a SELL signal as of 8/28/2014, so our long-term posture is bearish.
USO has stopped its free fall this week with a positive not negative price change. However, looking at the price of oil in the bottom pane, it hasn't reached the same lows that USO has which tells me there could still be further decline for USO.

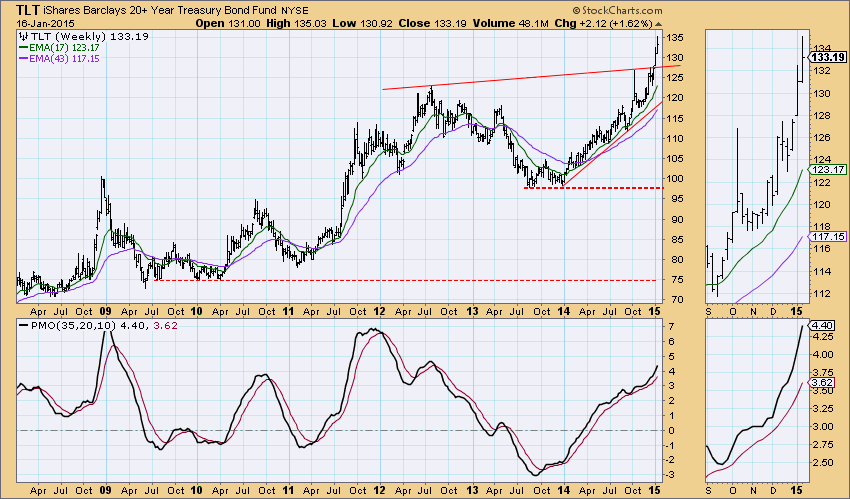
BONDS (TLT): As of 1/17/2014 The 20+ Year T-Bonds ETF (TLT) is on a Trend Model BUY signal. The LT Trend Model, which informs our long-term outlook, is on a BUY signal as of 3/24/2014, so our long-term posture is bullish.
Price continues its parabolic rise on the weekly chart. The PMO hasn't reached overbought territory, so momentum is strong and suggests the rally may not be over yet.
Technical Analysis is a windsock, not a crystal ball.
Happy Charting!
- Erin


