Standard & Poors has published preliminary S&P 500 results for the third quarter of 2014. Here is an excerpt from the DP Overview of Market Fundamentals report, which is available daily in the DP Reports Blog. We can see that, while the P/E is very close to the top of the normal range, earnings are projected to increase over the next three quarters.
DECISIONPOINT OVERVIEW OF MARKET FUNDAMENTALS
Wednesday  12/31/2014

*************************** S&P 500 FUNDAMENTALS ****************************

The real P/E for the S&P 500 is based on "as reported" or GAAP earnings
(calculated using Generally Accepted Accounting Principles), and it is the
standard for historical earnings comparisons. The normal range for the GAAP
P/E ratio is between 10 (undervalued) to 20 (overvalued).

Market cheerleaders invariably use "pro forma" or "operating earnings,"
which exclude some expenses and are often deceptively optimistic.

The following are the most recently reported and projected twelve-month
trailing (TMT) earnings, quarterly earnings, and price/earnings ratios (P/Es)
according to Standard and Poors.

                                             Est       Est       Est       Est
                               2014 Q3   2014 Q4   2015 Q1   2015 Q2   2015 Q3
TMT P/E Ratio (GAAP).......:     19.40     18.80     17.50     16.60     15.70
TMT P/E Ratio (Operating)..:     18.00     17.60     17.20     16.70     16.20

TMT Earnings (GAAP)........:    105.96    109.50    117.77    124.02    131.07
TMT Earnings (Operating)...:    114.51    116.76    120.04    122.99    126.79

QTRLY Earnings (GAAP)......:     27.47     30.02     33.15     33.39     34.52
QTRLY Earnings (Operating).:     29.60     30.50     30.60     32.29     33.40
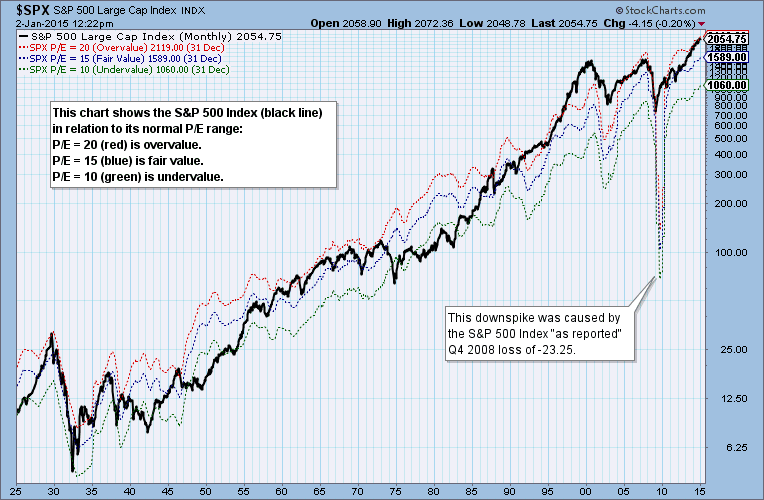
The following chart shows the relationship of the current S&P 500 price in relation to its normal P/E range. Although the limits of the range are not inviolate, we can see that the S&P 500 is generally contained by the range over time, and that overvalued conditions are less than ideal. We can also see in 1973-74 that rising earnings do not prevent bear markets.
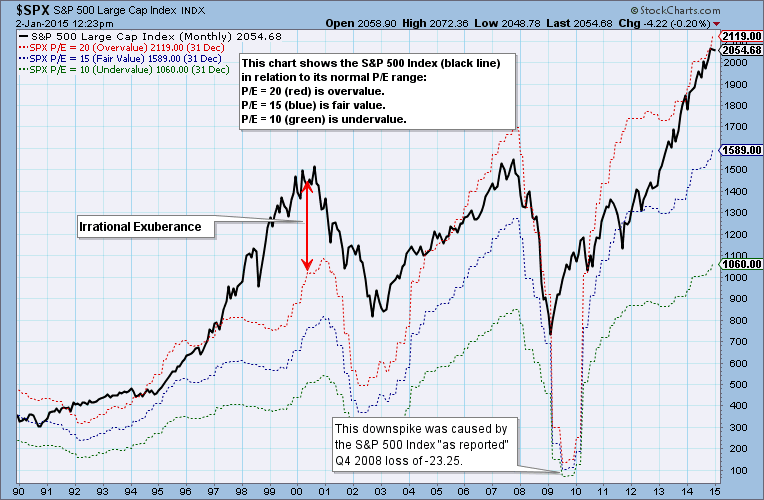
The following chart zooms in on the last 25 years and explains some of the extreme situations like 2000 and 2009. Also, it is clear that price can be pulled or pushed higher by rising earnings, so the current overvalued condition could be prevented from becoming worse (with P/Es higher than 20) if earnings continue to grow.
While we are technicians, an awareness of the fundamental condition of the market provides useful information to assist our analysis process.


