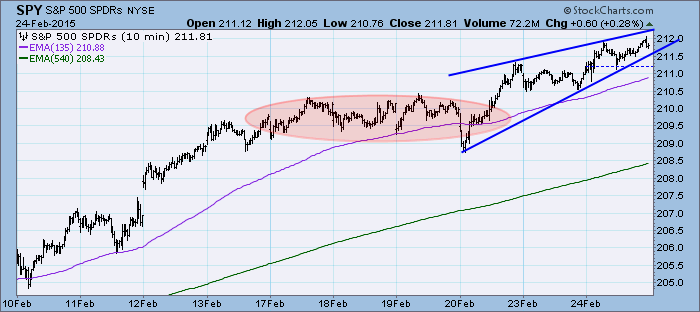
The market began trending higher after taking time to digest the this month's rally but it appears that there is downward pressure that has helped form a bearish ascending wedge. Expectation is a breakdown out of the wedge, but this is very short-term and the pattern only tells us that a breakdown out of the wedge is likely, not how far it will go.
The purpose of the DecisionPoint Daily Update is to quickly review the day's action, internal condition, and Trend Model status of the broad market (S&P 500), the nine SPDR Sectors, the U.S. Dollar, Gold, Crude Oil, and Bonds. To ensure that using this daily reference will be quick and painless, we are as brief as possible, and often we let a chart speak for itself.
SIGNALS: Here we include the current day's signal table, an excerpt from the DecisionPoint Alert Daily Report.
DECISIONPOINT ALERT DAILY REPORT
Tuesday, 2/24/2015

************************ DECISIONPOINT MARKET POSTURE ***********************

The following is the market posture suggested by our mechanical trend-
following tools. These are not trading recommendations, rather they are price
activity flags that should be qualified by chart analysis. The Trend Model is
used on all indexes.


                                     Days   Index     02/24   Points  Percent
Index               Posture     Date Elap  @Start     Close      P/L      P/L
------------------- ------- -------- ---- -------   -------  -------  -------
Stocks Medium-Term  Bullish 10/31/14  116   200.55   211.81   +11.26    +5.6%
Stocks Long-Term    Bullish 10/31/14  116   200.55   211.81   +11.26    +5.6%
Gold (NY Spot)      Bearish 02/23/15    1  1200.80  1197.30    +3.50    +0.3%
20+Yr T-Bond  (TLT) Bullish 01/17/14  403   102.22   129.67   +27.45   +26.9%
------------------- ------- -------- ---- -------   -------  -------  -------
Dollar Index  (UUP) Bullish 07/21/14  218    21.47    24.98    +3.51   +16.3%
Commodities   (GSG) Neutral 07/14/14  225    32.64    20.40     ....     ....
Crude Oil     (USO) Neutral 07/30/14  209    36.92    18.04     ....     ....
------------------- ------- -------- ---- -------   -------  -------  -------
S&P 500       (SPY)     BUY 10/31/14  116   200.55   211.81   +11.26    +5.6%
S&P Equal Wt  (RSP)     BUY 11/03/14  113    77.77    82.66    +4.89    +6.3%
Dow           (DIA)     BUY 02/03/15   21   175.85   181.91    +6.06    +3.4%
Nasdaq 100    (QQQ)     BUY 10/29/14  118    99.44   108.60    +9.16    +9.2%
NDX Equal Wt (QQEW)     BUY 10/30/14  117    40.52    44.49    +3.97    +9.8%
S&P 100       (OEF)     BUY 02/04/15   20    89.96    93.45    +3.49    +3.9%
S&P 400 MidCp (IJH)     BUY 11/05/14  111   141.11   151.59   +10.48    +7.4%
S&P 600 SmlCp (IJR)     BUY 11/03/14  113   110.95   116.82    +5.87    +5.3%
Total Market  (VTI)     BUY 11/03/14  113   103.53   109.52    +5.99    +5.8%
Consumer Disc (XLY)     BUY 11/05/14  111    67.27    75.73    +8.46   +12.6%
Cons Disc EWt (RCD)     BUY 11/03/14  113    82.65    91.43    +8.78   +10.6%
Consumer Stpl (XLP)     BUY 08/20/14  188    44.27    49.91    +5.64   +12.7%
Cons Stpl EWt (RHS)     BUY 10/21/14  126    97.79   109.25   +11.46   +11.7%
Energy        (XLE)     BUY 02/18/15    6    81.31    80.43    -0.88    -1.1%
Energy EWt    (RYE)     BUY 02/19/15    5    70.65    69.49    -1.16    -1.6%
Financial     (XLF)     BUY 02/13/15   11    24.43    24.50    +0.07    +0.3%
Financial EWt (RYF)     BUY 02/05/15   19    44.36    44.90    +0.54    +1.2%
Health Care   (XLV)     BUY 10/23/14  124    64.07    72.42    +8.35   +13.0%
Health Cr EWt (RYH)     BUY 05/09/14  291   115.84   152.00   +36.16   +31.2%
Industrial    (XLI)     BUY 10/30/14  117    54.37    58.14    +3.77    +6.9%
Industrl EWt  (RGI)     BUY 02/09/15   15    88.82    92.31    +3.49    +3.9%
Materials     (XLB)     BUY 02/05/15   19    50.04    52.09    +2.05    +4.1%
Materials EWt (RTM)     BUY 02/03/15   21    85.23    91.46    +6.23    +7.3%
Technology    (XLK)     BUY 02/09/15   15    41.04    43.24    +2.20    +5.4%
Technolgy EWt (RYT)     BUY 02/05/15   19    89.61    94.37    +4.76    +5.3%
Utilities     (XLU) Neutral 02/20/15    4    45.69    46.34     ....     ....
Utilities EWt (RYU)     BUY 08/20/14  188    71.41    77.93    +6.52    +9.1%

Average                                83                               +7.3%
NOTE: Mechanical trading model signals define the implied bias of the price index based upon moving average relationships, but they do not necessarily call for a specific action. They are information flags that should prompt chart review. Further, they do not call for continuous buying or selling during the life of the signal. For example, a BUY signal will probably return the best results if action is taken soon after the signal is generated. Additional opportunities for buying may be found as price zigzags higher, but the trader must look for optimum entry points. Conversely, exit points to preserve gains (or minimize losses) may be evident before the model mechanically closes the signal.
STOCKS: Based upon a 10/31/2014 Trend Model BUY signal, our current intermediate-term market posture for the S&P 500 (SPY) is bullish. The Trend Model, which informs our long-term outlook, is on a BUY signal as of 10/31/2014 so our long-term posture is bullish.
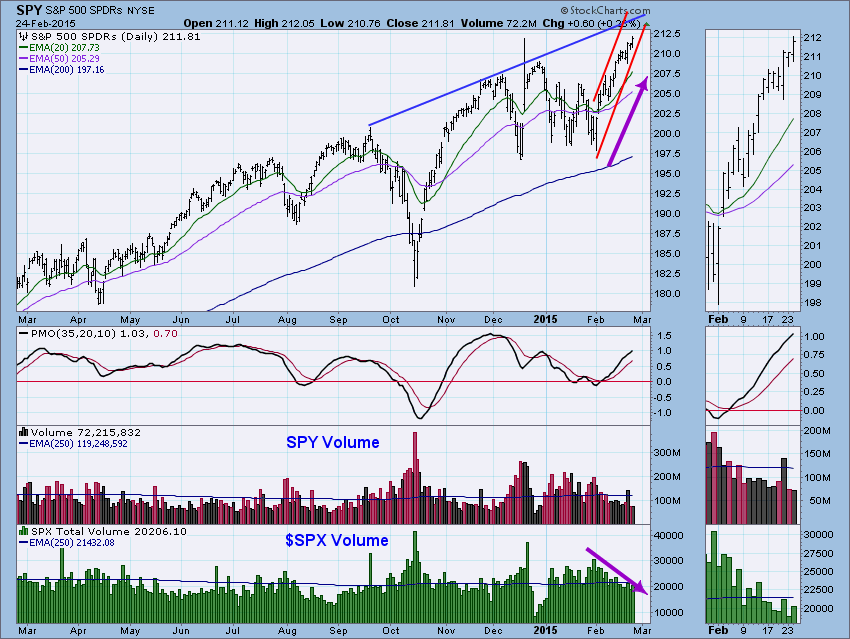
I've loosely drawn a rising trend channel. The problem with this rising trend is that it is awfully steep and consequently will be hard to maintain. Overhead resistance is coming up fast. One the big problems I have with this chart right now is the large divergence between volume and price. As I noted above, price is rising at a very accelerated pace, yet, volume has just as consistently been angling down. This shows us that there isn't as much excitement, participation and commitment to this rally as one would expect. With overhead resistance nearing, we need to start seeing higher volume.
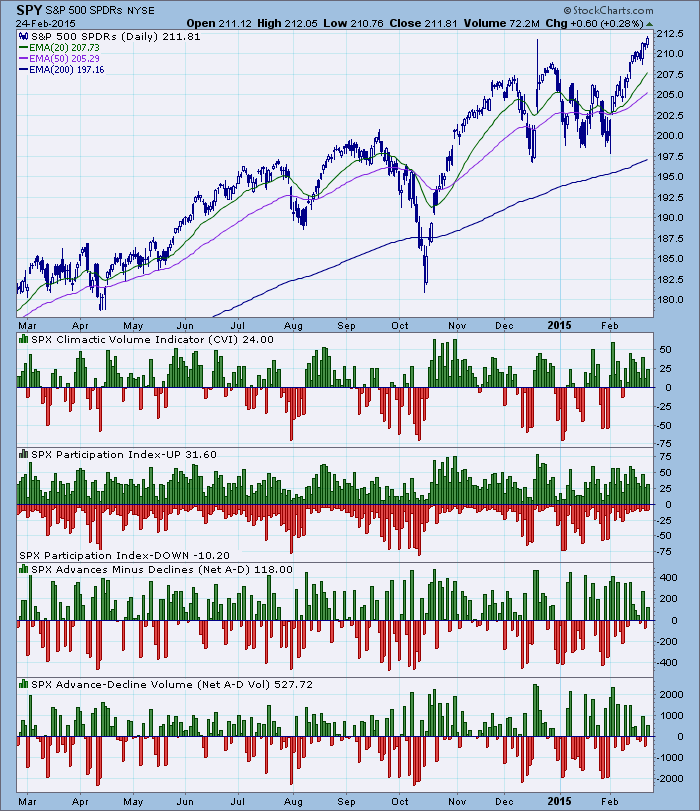
Ultra-Short-Term Indicators: Nothing of interest to report on our ultra-short-term indicators, no climaxes or spikes.
Short-Term Indicators: The STO-B and STO-V are getting ready to test their rising trends, a drop out of there would be very bearish. Readings are already declining.
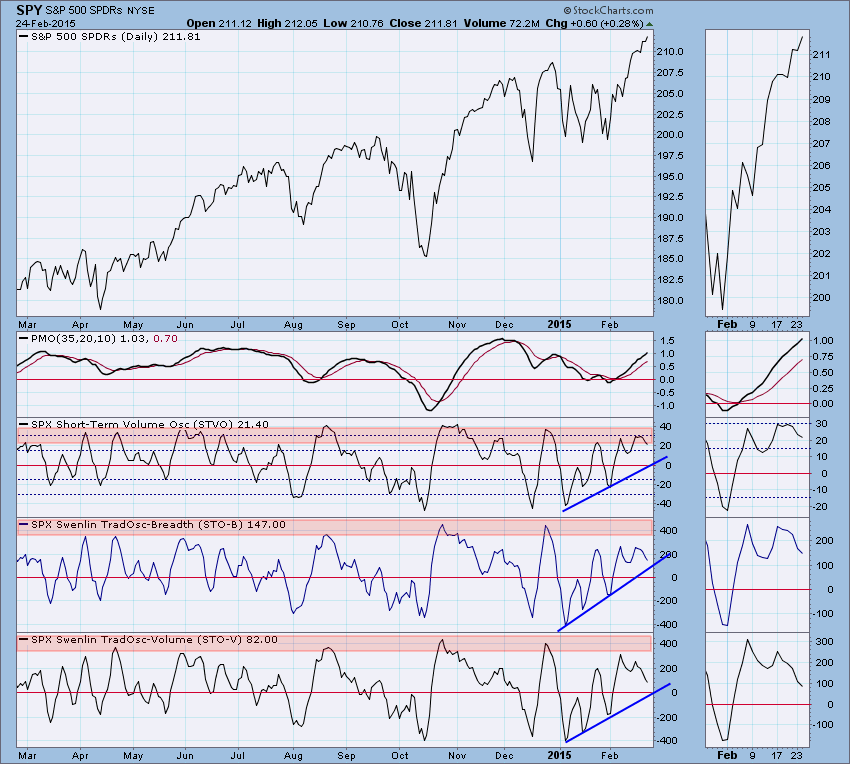
Intermediate-Term Indicators: These indicators are finally starting to get overbought. They have room to go before hitting overbought extremes, but they are nearing.
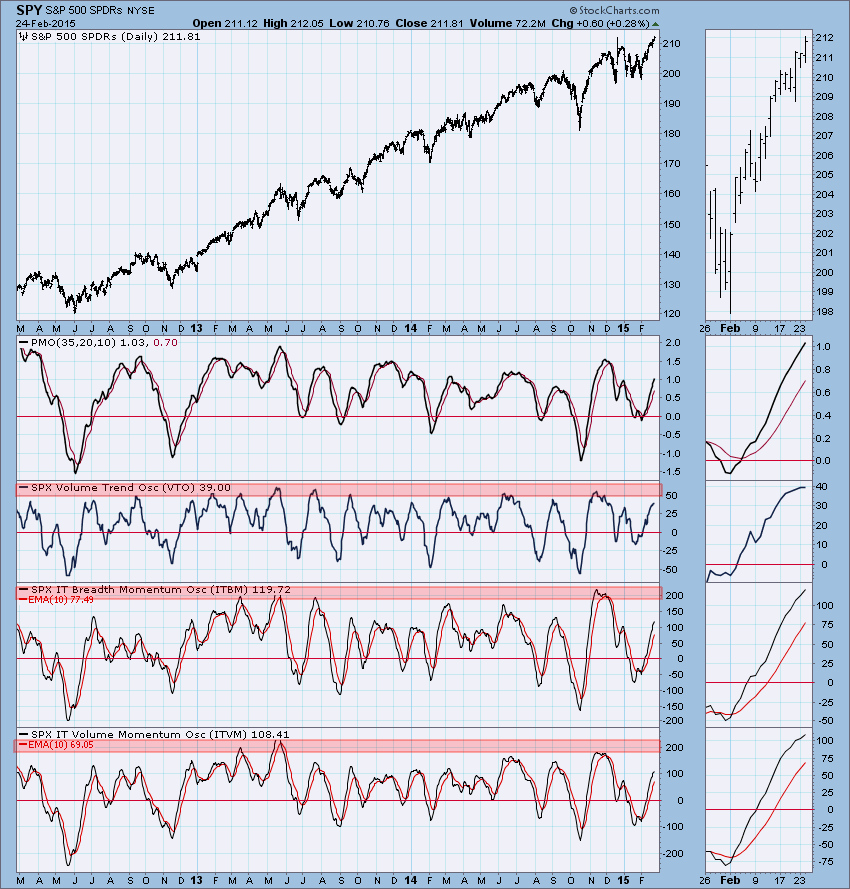
Conclusion: The market is continuing to rise steeply but that is a problem. First, overhead resistance is nearing right about the time our intermediate-term indicators are nearing overbought extremes. Internal strength is questionable with volume declining as price continues to rise and short-term indicators continue to drop. If you remember, the triple-bottom execution called for price to rise to about 214 on the SPY. That is still attainable, but overhead resistance will start laying pressure as price nears that target.
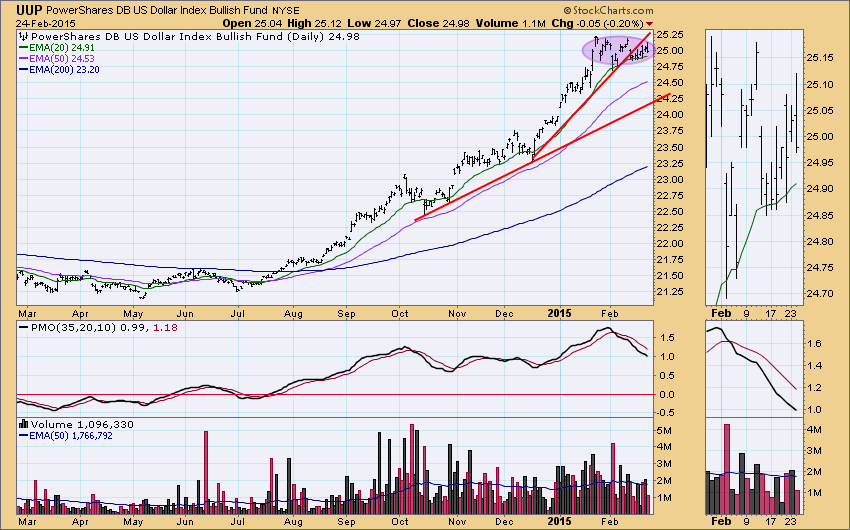
DOLLAR: As of 7/21/2014 the US Dollar Index ETF (UUP) is on a Trend Model BUY signal. The LT Trend Model, which informs our long-term outlook, is on a BUY signal as of 8/21/2014, so our long-term posture is bullish.
The dollar drifted through support, so I don't look at it as a breakdown. Price is churning and remaining above the 20-EMA which has acted as support. Looking in the thumbnail, we see that recent price movement is trending up. Until we see the PMO bottom, UUP is still vulnerable for a breakdown out of this price continuation pattern.
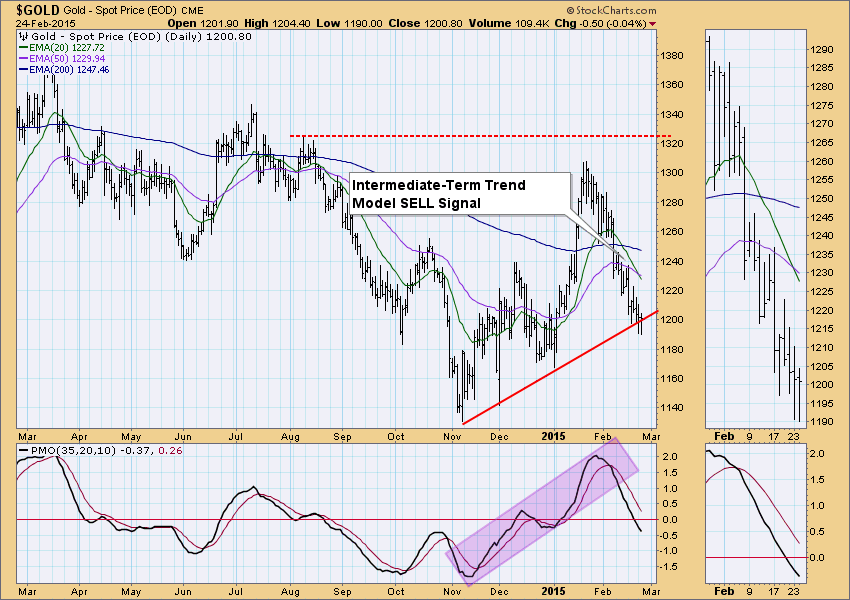
GOLD: As of 1/12/2015 Gold is on a Trend Model BUY signal. The LT Trend Model, which informs our long-term outlook, is on a SELL signal as of 2/15/2013, so our long-term posture is bearish.
For commentary on GOLD, please read Erin's blog article at this link.
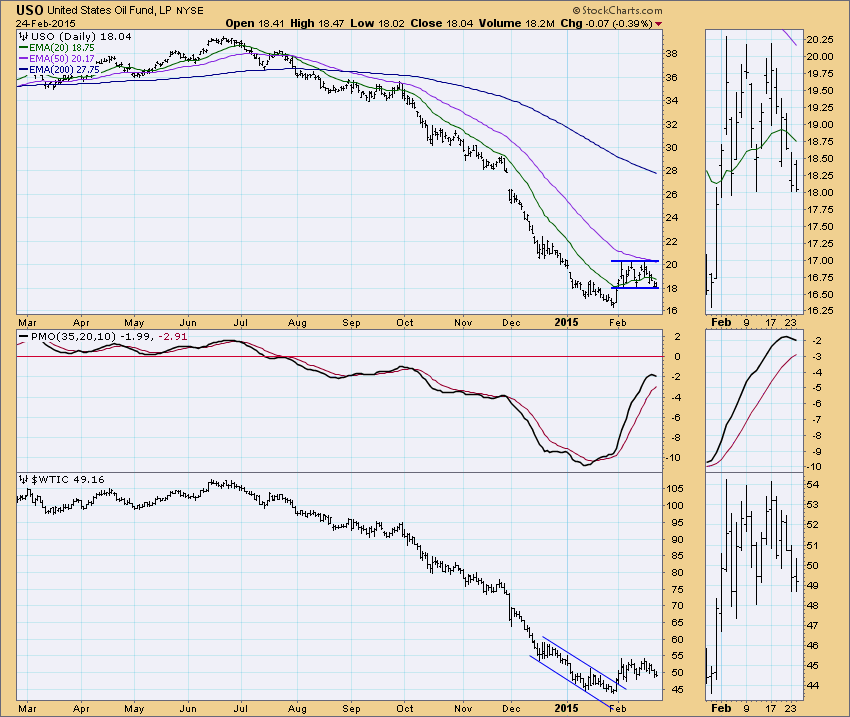
CRUDE OIL (USO): As of 7/30/2014 United States Oil Fund (USO) is on a Trend Model NEUTRAL signal. The LT Trend Model, which informs our long-term outlook, is on a SELL signal as of 8/28/2014, so our long-term posture is bearish.
For commentary on Oil, please read Carl's blog article at this link.
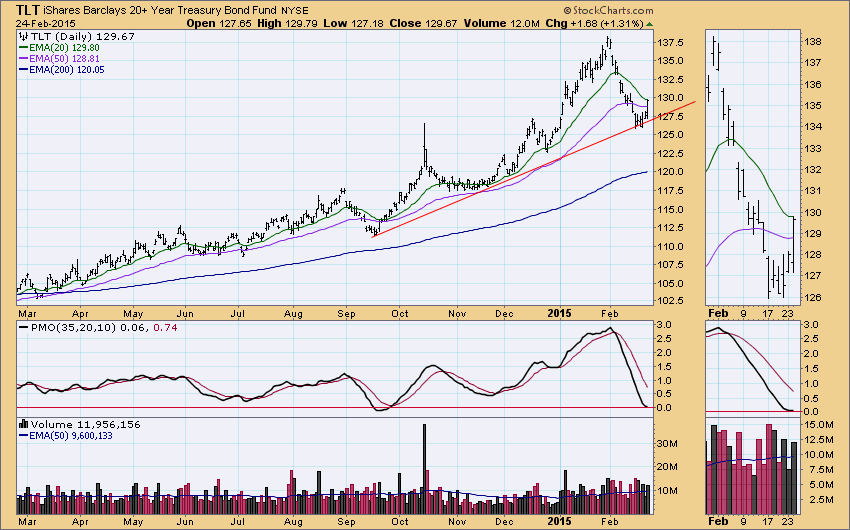
BONDS (TLT): As of 1/17/2014 The 20+ Year T-Bonds ETF (TLT) is on a Trend Model BUY signal. The LT Trend Model, which informs our long-term outlook, is on a BUY signal as of 3/24/2014, so our long-term posture is bullish.
Bonds had a somewhat unexpected bounce off of support today. Unexpected based on the PMO and its steep and steady decline after the PMO crossover SELL signal the first week of February. Yet not completely unexpected since support had been reached and successfully tested for about a week. Today's rally has the PMO flattening in possible anticipation for a bottom.
Don't forget to sign up to attend the next DecisionPoint LIVE! webinar where Carl Swenlin will appear with me this Wednesday, February 25th. Here is a link to the sign up page. Be sure to tweet your chart requests @_DecisionPoint for guaranteed review or bring them and it might be chosen for review at the end of the program.
Happy Charting!
Erin
Technical Analysis is a windsock, not a crystal ball.
Happy Charting!
- Erin


