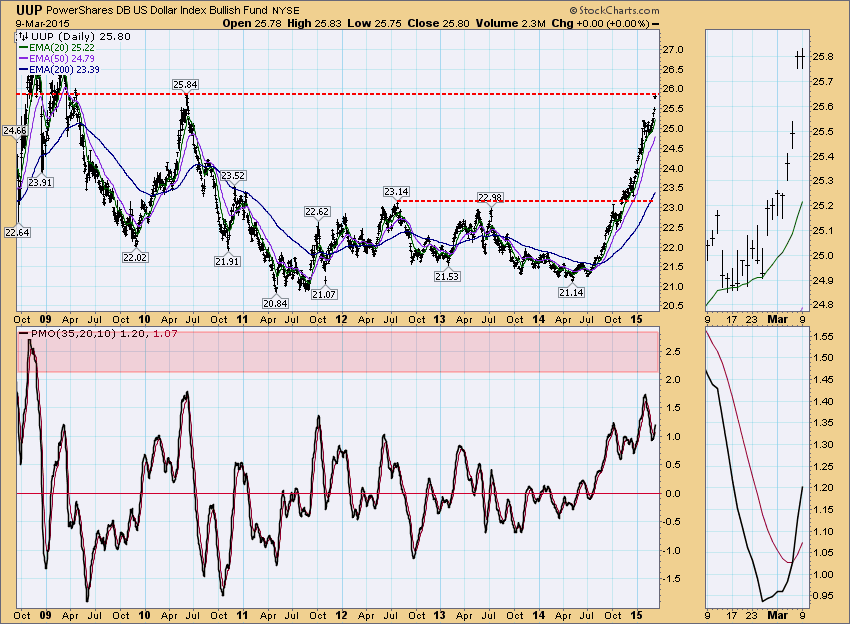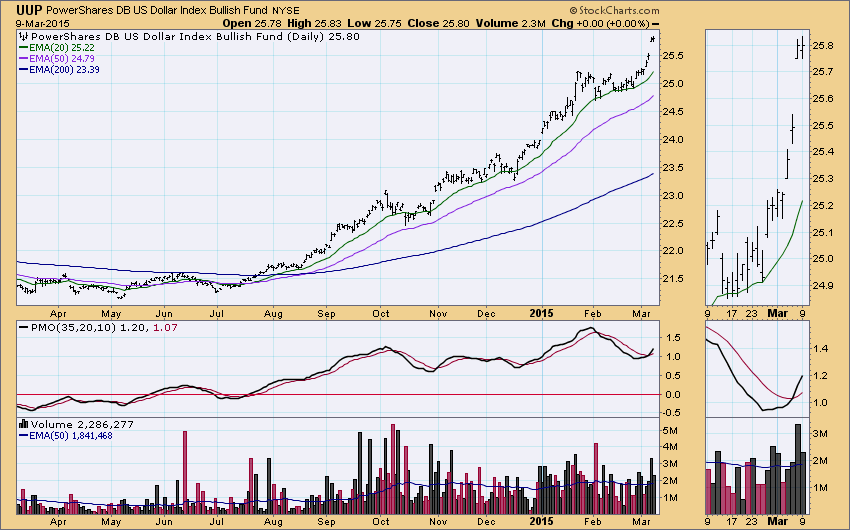
Last Friday the dollar gapped up to reach overhead resistance at the 2010 high. Looking at UUP, the dollar ETF, we see that today, resistance held. The question now is whether it will be able to break out and set a new multi-year high. Looking at the Price Momentum Oscillator (PMO), we see that there was a crossover BUY signal generated last week as the PMO crossed above its 10-EMA which suggests a breakout is imminent.
On a shorter-term daily chart it appears that the PMO is very overbought, but the chart above demonstrates that is not really the case when you look at the extremes it reached in 2008. It is always a good idea to open up your daily chart to a longer than 5 year period to see what the typical range is for the PMO. You can then evaluate the condition in addition to weighing trends using the location of the 20/50/200-EMAs. UUP has a strong DecisionPoint Trend Model configuration with large distances between EMAs that are configured positively (i.e. 20 >50>200-EMAs).
Happy Charting!
Erin


