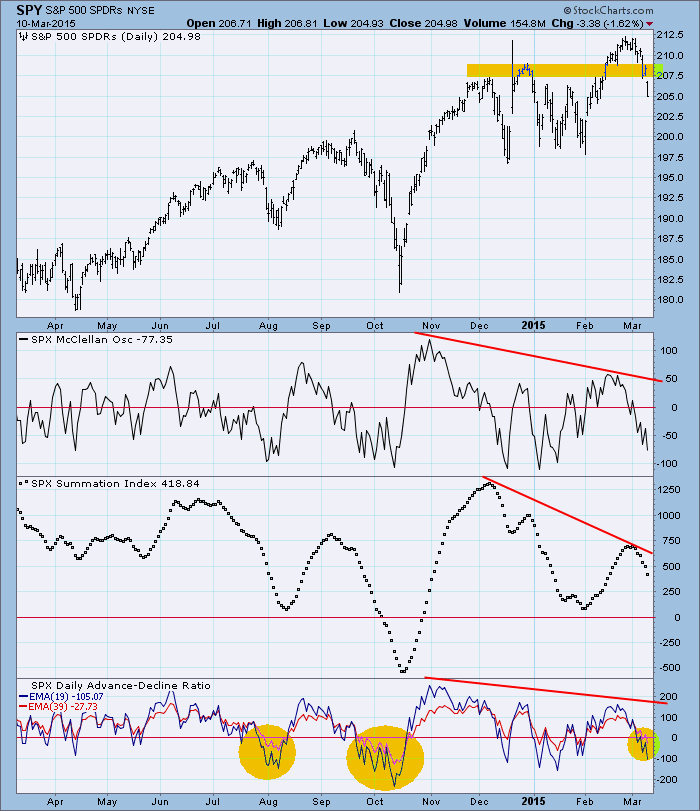
The McClellan Oscillator is a venerable indicator that was introduced in the late 1960s by Sherman and Marian McClellan. It is still followed today by many technical analysts, but I think many people find it a little intimidating, so I'd like to quickly review how I use it and see what it is telling us today. An important point of DecisionPoint's coverage on StockCharts.com is that we publish a version of the Oscillator for most major indexes as well as for the nine S&P sector indexes, and a DecisionPoint ChartPack containing all the versions is available. The chart below is the version for the S&P 500 Index, which means that it only uses the advance-decline data for the components of that index.
The calculations are as follows:
The principal components of the Oscillator are fast (19EMA) and slow (39EMA) moving averages of the daily advance-decline ratio: (advances minus declines) divided by (advances plus declines).
The McClellan Oscillator, a short-term indicator, is the difference between those moving averages -- subtract the 39EMA from the 19EMA.
The Summation Index, a medium-term indicator, is the cumulative total of the daily McClellan Oscillator.
The general rule is that the market environment is bearish when the Oscillator drops below the zero line; however, we can plainly see that not all of such occurrences result in serious downward pressure on prices. This is why I normally refer to the bottom panel on the chart, which shows the relationship of the 19EMA and 39EMA to each other and to their zero line. It is my observation that market conditions are most precarious when those EMAs drop below the zero line and remain there. (I have highlighted two such instances around August and October.) Clearly, incursions below the zero line are often brief and mark the end of short corrections, but when the EMAs drop below the zero line, we should still be alert for continued price weakness, at least until they start rising again.
As for the current market picture, both EMAs have dropped below their zero line as of today's close. We can't say with certainty that they will remain there, but other evidence suggests that they will. For example, there are negative divergences on the EMAs and Summation Index, and this condition is repeated on numerous other medium-term charts (not shown). My assumption is that the Summation Index will retreat at least to the zero line, and the implication is that this correction has farther to go. Of course, based upon today's market action that is fairly obvious.
Next we should watch for the Summation Index to drop below its zero line. If that happens, the market environment will be very dangerous.
Conclusion: When interpreting the McClellan Oscillator, it is useful to keep an eye on the EMAs, the basic components of the Oscillator. If they linger below their zero line, expect more price decline. While the Oscillator is a short-term indicator, the Summation Index gives us a longer-term of internals. When it drops below its zero line use extreme caution until it at least starts rising again.
For more detail on how these indicators are calculated there is an article in ChartSchool and, of course, it gets firsthand coverage on Tom McClellan's mcoscillator.com website.


