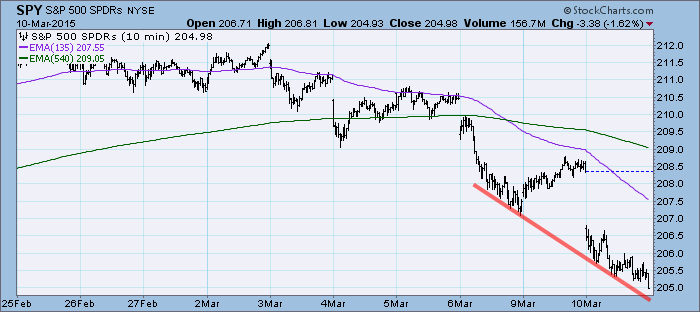
Yesterday, price managed to turn up and scalp some losses, but today prices gapped down and continued lower, basically taking over where it left off on Friday.
The purpose of the DecisionPoint Daily Update is to quickly review the day's action, internal condition, and Trend Model status of the broad market (S&P 500), the nine SPDR Sectors, the U.S. Dollar, Gold, Crude Oil, and Bonds. To ensure that using this daily reference will be quick and painless, we are as brief as possible, and often we let a chart speak for itself.
SIGNALS: Here we include the current day's signal table, an excerpt from the DecisionPoint Alert Daily Report.
DECISIONPOINT ALERT DAILY REPORT
Tuesday, 3/10/2015

************************ DECISIONPOINT MARKET POSTURE ***********************

The following is the market posture suggested by our mechanical trend-
following tools. These are not trading recommendations, rather they are price
activity flags that should be qualified by chart analysis. The Trend Model is
used on all indexes.


                                     Days   Index     03/10   Points  Percent
Index               Posture     Date Elap  @Start     Close      P/L      P/L
------------------- ------- -------- ---- -------   -------  -------  -------
Stocks Medium-Term  Bullish 10/31/14  130   200.55   204.98    +4.43    +2.2%
Stocks Long-Term    Bullish 10/31/14  130   200.55   204.98    +4.43    +2.2%
Gold (NY Spot)      Bearish 02/23/15   15  1200.80  1160.10   +40.70    +3.4%
20+Yr T-Bond  (TLT) Neutral 03/06/15    4   123.50   126.28     ....     ....
------------------- ------- -------- ---- -------   -------  -------  -------
Dollar Index  (UUP) Bullish 07/21/14  232    21.47    26.07    +4.60   +21.4%
Commodities   (GSG) Neutral 07/14/14  239    32.64    20.01     ....     ....
Crude Oil     (USO) Neutral 07/30/14  223    36.92    17.91     ....     ....
------------------- ------- -------- ---- -------   -------  -------  -------
S&P 500       (SPY)     BUY 10/31/14  130   200.55   204.98    +4.43    +2.2%
S&P Equal Wt  (RSP)     BUY 11/03/14  127    77.77    79.75    +1.98    +2.5%
Dow           (DIA)     BUY 02/03/15   35   175.85   176.69    +0.84    +0.5%
Nasdaq 100    (QQQ)     BUY 10/29/14  132    99.44   105.72    +6.28    +6.3%
NDX Equal Wt (QQEW)     BUY 10/30/14  131    40.52    43.53    +3.01    +7.4%
S&P 100       (OEF)     BUY 02/04/15   34    89.96    90.46    +0.50    +0.6%
S&P 400 MidCp (IJH)     BUY 11/05/14  125   141.11   147.26    +6.15    +4.4%
S&P 600 SmlCp (IJR)     BUY 11/03/14  127   110.95   114.00    +3.05    +2.7%
Total Market  (VTI)     BUY 11/03/14  127   103.53   106.22    +2.69    +2.6%
Consumer Disc (XLY)     BUY 11/05/14  125    67.27    74.66    +7.39   +11.0%
Cons Disc EWt (RCD)     BUY 11/03/14  127    82.65    89.86    +7.21    +8.7%
Consumer Stpl (XLP)     BUY 08/20/14  202    44.27    48.33    +4.06    +9.2%
Cons Stpl EWt (RHS)     BUY 10/21/14  140    97.79   106.32    +8.53    +8.7%
Energy        (XLE)    SELL 03/05/15    5    78.18    75.17    +3.01    +3.9%
Energy EWt    (RYE)    SELL 03/06/15    4    65.78    63.49    +2.29    +3.5%
Financial     (XLF)     BUY 02/13/15   25    24.43    23.82    -0.61    -2.5%
Financial EWt (RYF)     BUY 02/05/15   33    44.36    43.87    -0.49    -1.1%
Health Care   (XLV)     BUY 10/23/14  138    64.07    71.05    +6.98   +10.9%
Health Cr EWt (RYH)     BUY 05/09/14  305   115.84   150.07   +34.23   +29.5%
Industrial    (XLI)     BUY 10/30/14  131    54.37    55.94    +1.57    +2.9%
Industrl EWt  (RGI)     BUY 02/09/15   29    88.82    88.90    +0.08    +0.1%
Materials     (XLB)     BUY 02/05/15   33    50.04    49.76    -0.28    -0.6%
Materials EWt (RTM)     BUY 02/03/15   35    85.23    86.50    +1.27    +1.5%
Technology    (XLK)     BUY 02/09/15   29    41.04    41.72    +0.68    +1.7%
Technolgy EWt (RYT)     BUY 02/05/15   33    89.61    91.37    +1.76    +2.0%
Utilities     (XLU) Neutral 02/20/15   18    45.69    43.39     ....     ....
Utilities EWt (RYU) Neutral 02/25/15   13    76.90    73.37     ....     ....

Average                                89                               +4.7%
NOTE: Mechanical trading model signals define the implied bias of the price index based upon moving average relationships, but they do not necessarily call for a specific action. They are information flags that should prompt chart review. Further, they do not call for continuous buying or selling during the life of the signal. For example, a BUY signal will probably return the best results if action is taken soon after the signal is generated. Additional opportunities for buying may be found as price zigzags higher, but the trader must look for optimum entry points. Conversely, exit points to preserve gains (or minimize losses) may be evident before the model mechanically closes the signal.
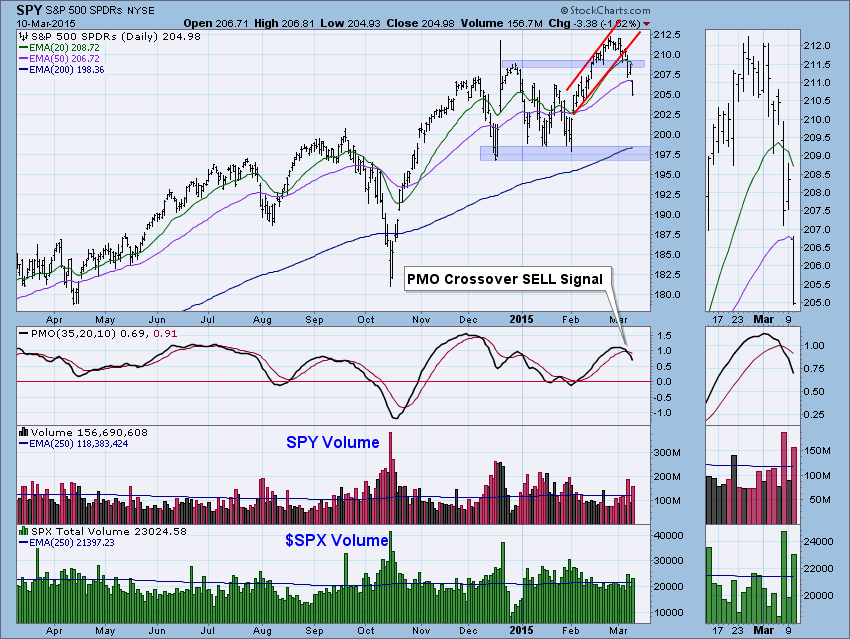
STOCKS: Based upon a 10/31/2014 Trend Model BUY signal, our current intermediate-term market posture for the S&P 500 (SPY) is bullish. The Trend Model, which informs our long-term outlook, is on a BUY signal as of 10/31/2014 so our long-term posture is bullish.
When I first looked at this chart, I was confused that there wasn't a bar for today until I realized that price had gapped down below the 50-EMA. The market attempted to stay within the area of support near the December highs after breaking down from the rising trend channel. Instead the "pullback" turned into a full-blown correction as price has now broken decisively below support. The next area of support isn't available until price reaches 197.5. This seems plausible as we just saw a negative PMO crossover SELL signal last week. Volume was high during the original breakdown from the channel and today mimicked that also with high volume.
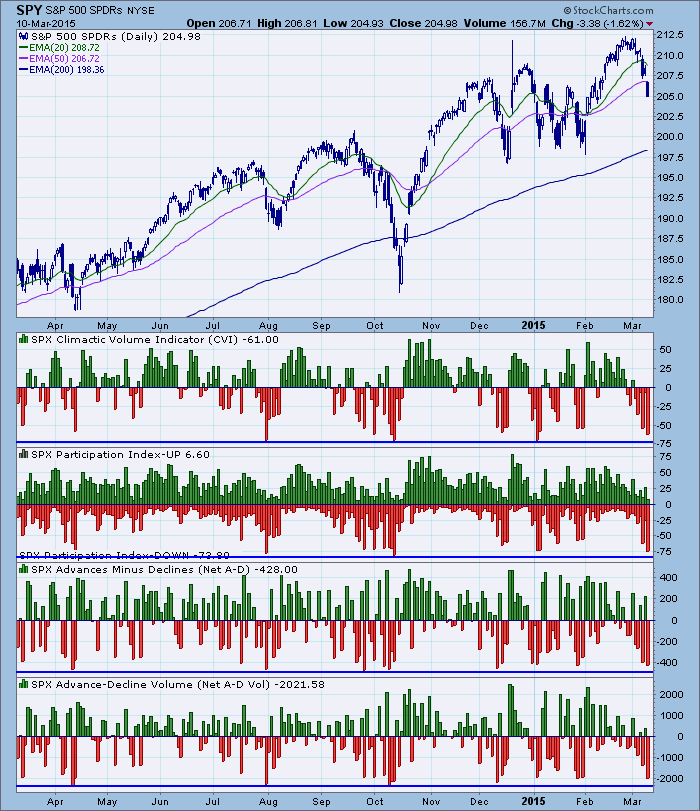
Ultra-Short-Term Indicators: The CVI and Participation Index - DOWN both spiked lower in climactic fashion. I note that these climaxes have not yet reached the potency of the lows at the base of the October correction so I see this as an initiation impulse that tells us the market has not quite hit bottom yet in the ultra-short term.
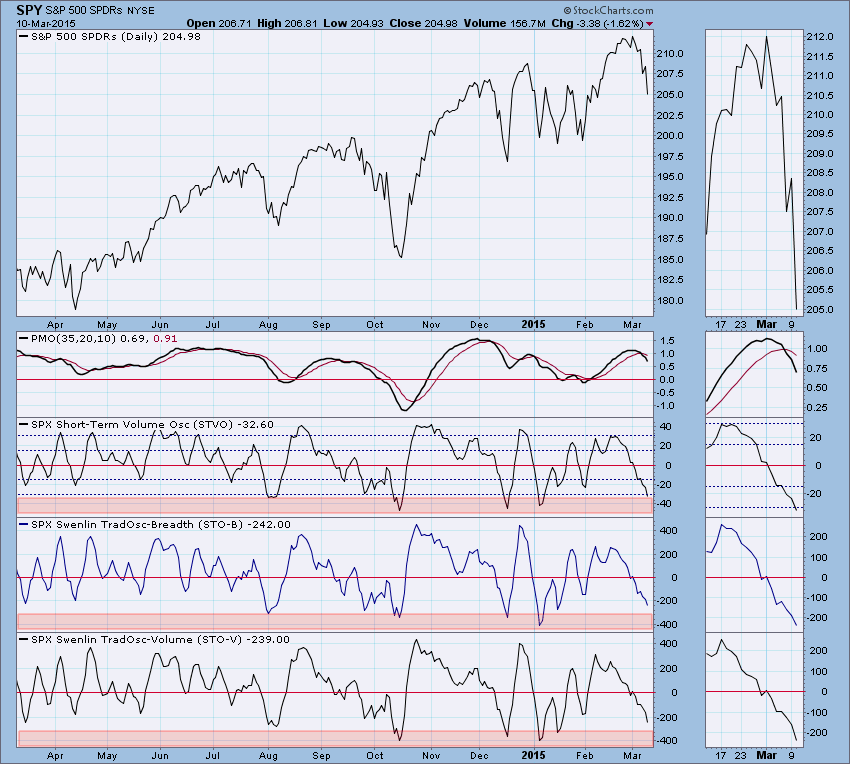
Short-Term Indicators: Short-term indicators are still dropping which is negative. However, they are oversold and will soon be nearing oversold extremes. Until then the picture is still quite bearish.
Intermediate-Term Indicators: Are neutral and declining which is bearish in the intermediate term. We will now watch to see if readings break below the current positive trend.
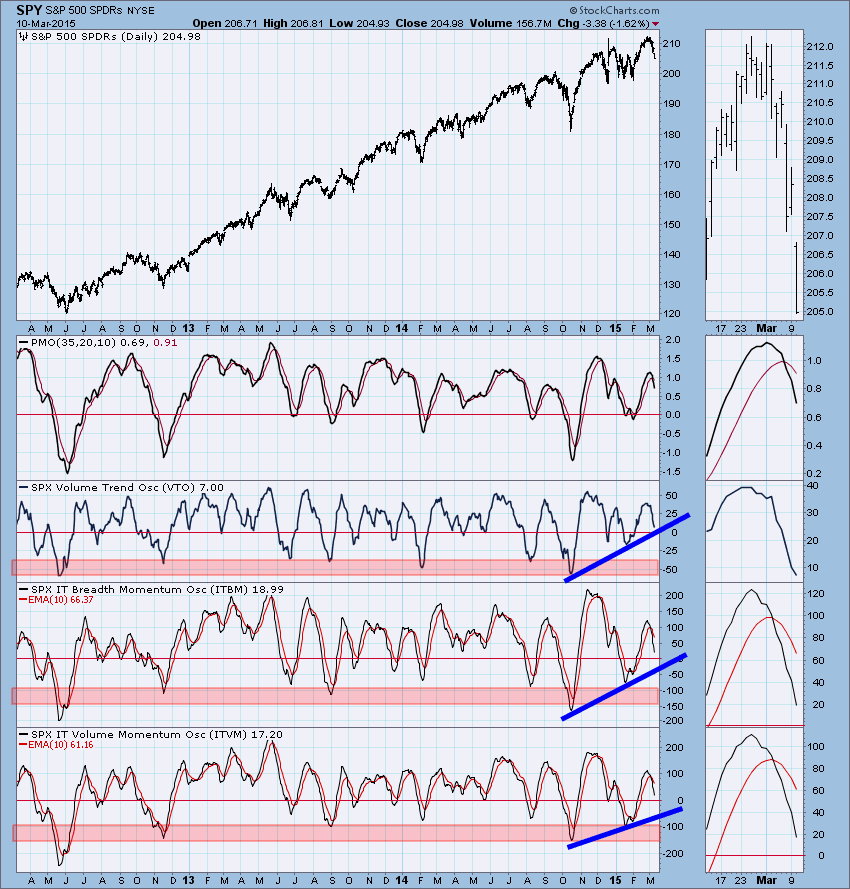
Conclusion: Indicators are bearish in all three timeframes, but short-term indicators are nearing oversold extremes and intermediate-term indicators are approaching the base of a rising trend line so there is still hope for a near-term bottom, but a look at the overbought and falling PMO tell me that downward momentum will be tough to overcome.
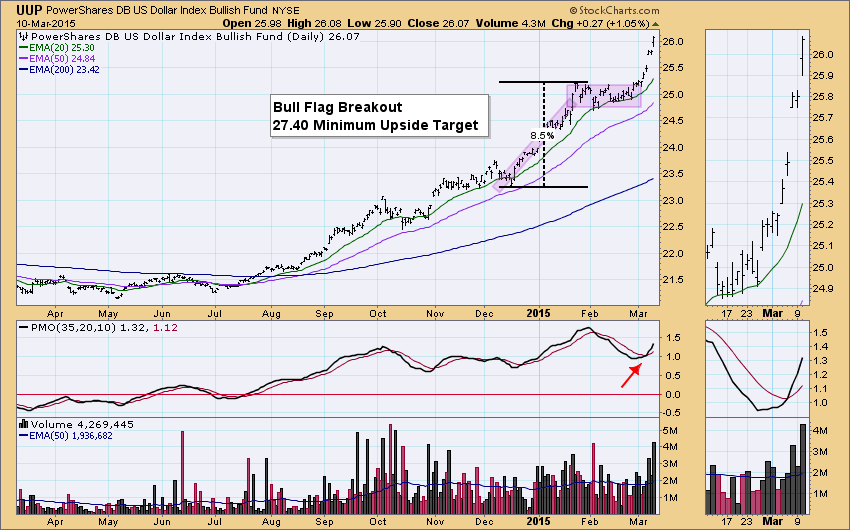
DOLLAR: As of 7/21/2014 the US Dollar Index ETF (UUP) is on a Trend Model BUY signal. The LT Trend Model, which informs our long-term outlook, is on a BUY signal as of 8/21/2014, so our long-term posture is bullish.
The dollar broke out of the bullish flag formation last week but then hesitated at long-term resistance (see my blog article from last night). With the decisive breakout above resistance at the top of the flag, it seemed only a matter of time before UUP continued higher as it did today. The 27.40 minimum upside target calculated by the execution of the flag shouldn't be too hard to hit if momentum continues to carry. One concern might be that the PMO looks overbought. Our first thought would be that even though a positive crossover BUY signal generated last week, there could be problems.
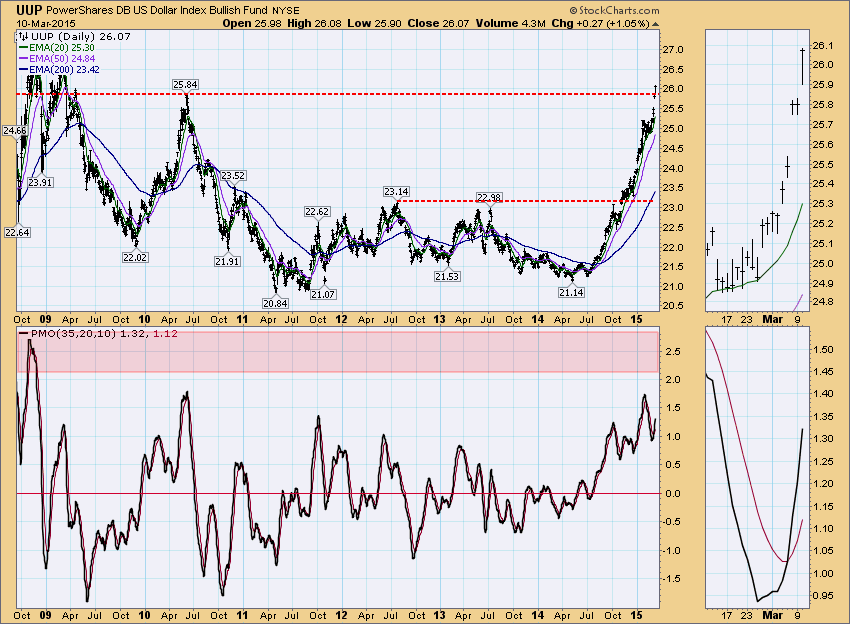
However, a quick look at a longer-term daily chart and we see a few things. First, the PMO isn't actually that overbought. Second, today's move broke through resistance and set a new multi-year high.
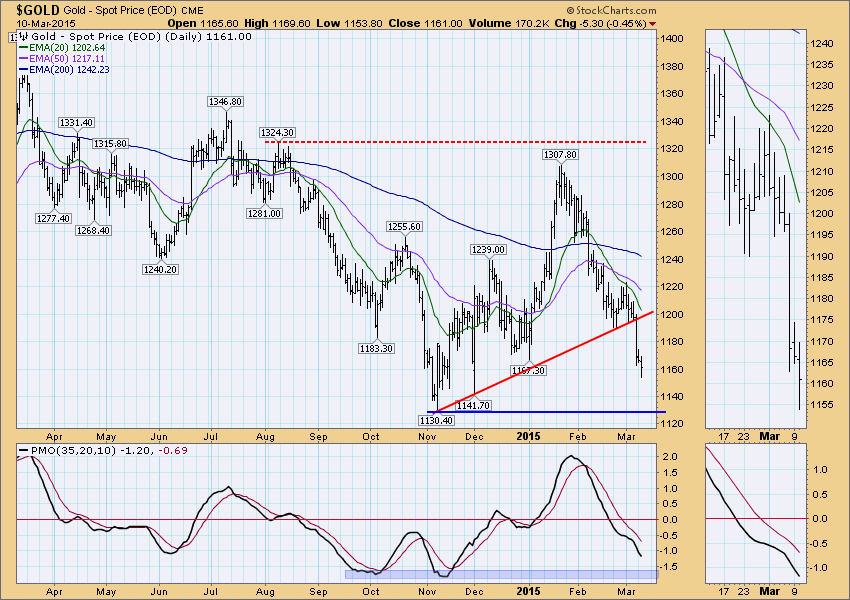
GOLD: As of 2/23/2015 Gold is on a Trend Model SELL signal. The LT Trend Model, which informs our long-term outlook, is on a SELL signal as of 2/15/2013, so our long-term posture is bearish.
Gold paused yesterday after its large decline, but it continued in earnest today. The next area of support is approaching quickly. The PMO is nearing oversold territory, so maybe we will see a rebound on gold when it reaches support. For now, the PMO is accelerating downward which is very bearish.
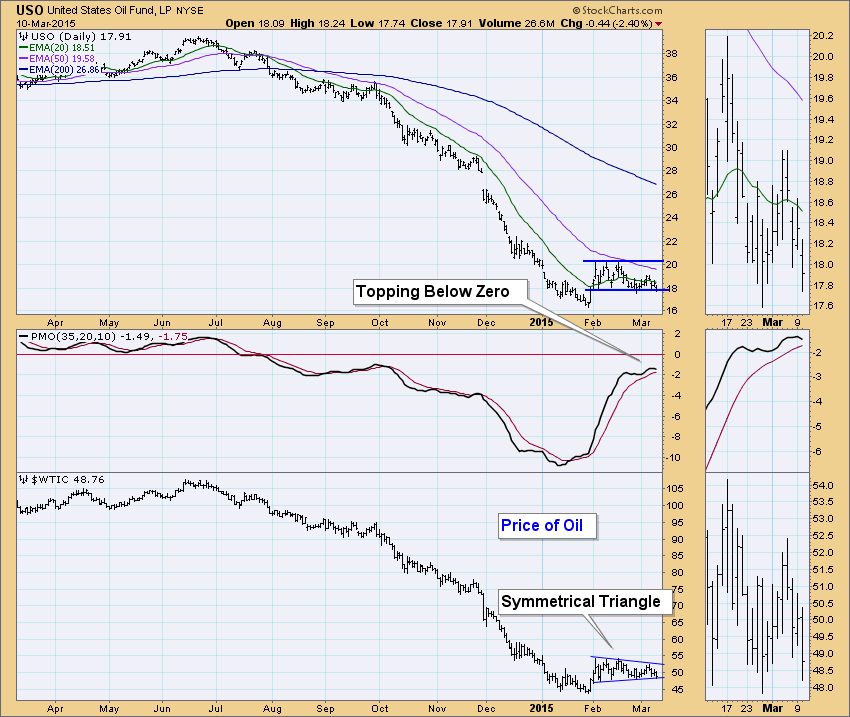
CRUDE OIL (USO): As of 7/30/2014 United States Oil Fund (USO) is on a Trend Model NEUTRAL signal. The LT Trend Model, which informs our long-term outlook, is on a SELL signal as of 8/28/2014, so our long-term posture is bearish.
USO reached the bottom of the consolidation trading range. The PMO has just topped below zero which is very bearish, so expectation would be to see price break down out of this area of consolidation. I do note that there is a symmetrical triangle on oil prices. These patterns have been categorized as "reversal" patterns, because more times than not price breaks in the opposite direction of the previous trend. Due to the PMO top in neutral territory, I'm thinking this will be one of those "nots" and we will see oil price continue lower.
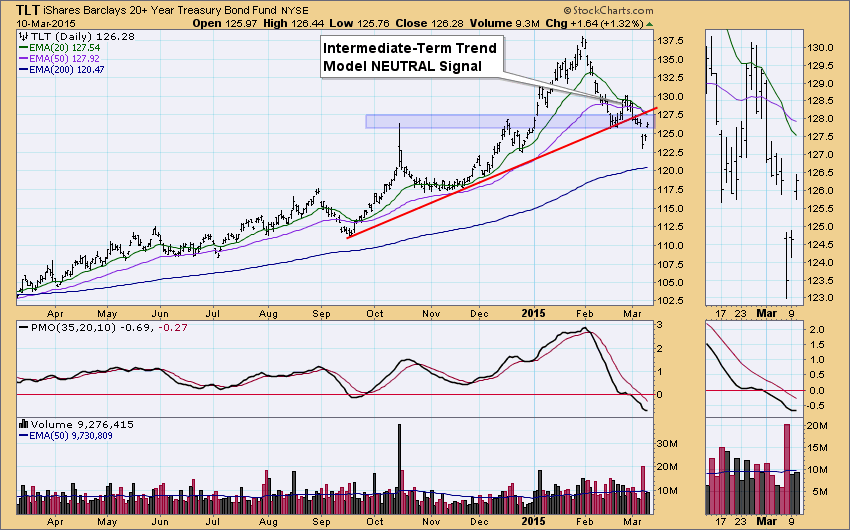
BONDS (TLT): As of 3/6/2015 The 20+ Year T-Bonds ETF (TLT) is on a Trend Model Neutral signal. The LT Trend Model, which informs our long-term outlook, is on a BUY signal as of 3/24/2014, so our long-term posture is bullish.
After breaking down decisively below the rising bottoms trend line and nearly decisively below horizontal support. Price bounced back into the resistance/support area at the 2014 highs. A recent Neutral signal was generated on the Intermediate-Term Trend Model when the 20-EMA crossed below the 50-EMA. The PMO is in near-term oversold territory so this recent breakdown may be the end of it. We could see the Trend Model reverse the Neutral signal quickly if price gets above the 20/50-EMAs soon.
Technical Analysis is a windsock, not a crystal ball.
Happy Charting!
- Erin


