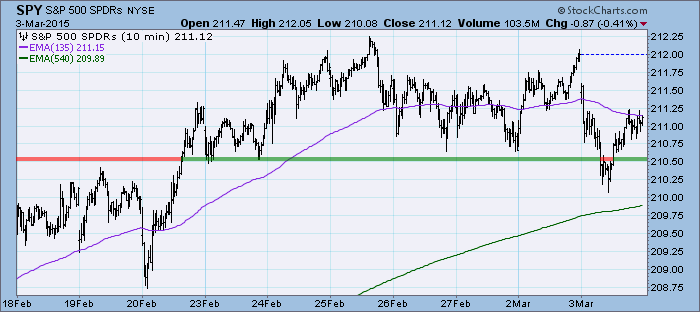
Prices corrected through mid-day but managed to pare down some of the losses with a late-day rally. You can see that price has been in a continuation pattern for over a week. Today it appeared horizontal support would not hold, but the prices pulled themselves back up into the consolidation zone by the end of the day.
The purpose of the DecisionPoint Daily Update is to quickly review the day's action, internal condition, and Trend Model status of the broad market (S&P 500), the nine SPDR Sectors, the U.S. Dollar, Gold, Crude Oil, and Bonds. To ensure that using this daily reference will be quick and painless, we are as brief as possible, and often we let a chart speak for itself.
SIGNALS: Here we include the current day's signal table, an excerpt from the DecisionPoint Alert Daily Report.
DECISIONPOINT ALERT DAILY REPORT
Tuesday, 3/3/2015

************************ DECISIONPOINT MARKET POSTURE ***********************

The following is the market posture suggested by our mechanical trend-
following tools. These are not trading recommendations, rather they are price
activity flags that should be qualified by chart analysis. The Trend Model is
used on all indexes.


                                     Days   Index     03/03   Points  Percent
Index               Posture     Date Elap  @Start     Close      P/L      P/L
------------------- ------- -------- ---- -------   -------  -------  -------
Stocks Medium-Term  Bullish 10/31/14  123   200.55   211.12   +10.57    +5.3%
Stocks Long-Term    Bullish 10/31/14  123   200.55   211.12   +10.57    +5.3%
Gold (NY Spot)      Bearish 02/23/15    8  1200.80  1204.40    -3.60    -0.3%
20+Yr T-Bond  (TLT) Bullish 01/17/14  410   102.02   126.41   +24.39   +23.9%
------------------- ------- -------- ---- -------   -------  -------  -------
Dollar Index  (UUP) Bullish 07/21/14  225    21.47    25.24    +3.77   +17.6%
Commodities   (GSG) Neutral 07/14/14  232    32.64    20.78     ....     ....
Crude Oil     (USO) Neutral 07/30/14  216    36.92    18.49     ....     ....
------------------- ------- -------- ---- -------   -------  -------  -------
S&P 500       (SPY)     BUY 10/31/14  123   200.55   211.12   +10.57    +5.3%
S&P Equal Wt  (RSP)     BUY 11/03/14  120    77.77    82.25    +4.48    +5.8%
Dow           (DIA)     BUY 02/03/15   28   175.85   181.87    +6.02    +3.4%
Nasdaq 100    (QQQ)     BUY 10/29/14  125    99.44   108.87    +9.43    +9.5%
NDX Equal Wt (QQEW)     BUY 10/30/14  124    40.52    44.70    +4.18   +10.3%
S&P 100       (OEF)     BUY 02/04/15   27    89.96    93.21    +3.25    +3.6%
S&P 400 MidCp (IJH)     BUY 11/05/14  118   141.11   150.86    +9.75    +6.9%
S&P 600 SmlCp (IJR)     BUY 11/03/14  120   110.95   116.77    +5.82    +5.2%
Total Market  (VTI)     BUY 11/03/14  120   103.53   109.24    +5.71    +5.5%
Consumer Disc (XLY)     BUY 11/05/14  118    67.27    76.67    +9.40   +14.0%
Cons Disc EWt (RCD)     BUY 11/03/14  120    82.65    92.32    +9.67   +11.7%
Consumer Stpl (XLP)     BUY 08/20/14  195    44.27    49.91    +5.64   +12.7%
Cons Stpl EWt (RHS)     BUY 10/21/14  133    97.79   109.48   +11.69   +12.0%
Energy        (XLE)     BUY 02/18/15   13    81.31    78.76    -2.55    -3.1%
Energy EWt    (RYE)     BUY 02/19/15   12    70.65    67.68    -2.97    -4.2%
Financial     (XLF)     BUY 02/13/15   18    24.43    24.46    +0.03    +0.1%
Financial EWt (RYF)     BUY 02/05/15   26    44.36    44.77    +0.41    +0.9%
Health Care   (XLV)     BUY 10/23/14  131    64.07    72.23    +8.16   +12.7%
Health Cr EWt (RYH)     BUY 05/09/14  298   115.84   151.80   +35.96   +31.0%
Industrial    (XLI)     BUY 10/30/14  124    54.37    57.65    +3.28    +6.0%
Industrl EWt  (RGI)     BUY 02/09/15   22    88.82    91.42    +2.60    +2.9%
Materials     (XLB)     BUY 02/05/15   26    50.04    51.55    +1.51    +3.0%
Materials EWt (RTM)     BUY 02/03/15   28    85.23    90.45    +5.22    +6.1%
Technology    (XLK)     BUY 02/09/15   22    41.04    43.14    +2.10    +5.1%
Technolgy EWt (RYT)     BUY 02/05/15   26    89.61    94.29    +4.68    +5.2%
Utilities     (XLU) Neutral 02/20/15   11    45.69    44.63     ....     ....
Utilities EWt (RYU) Neutral 02/25/15    6    76.90    75.66     ....     ....

Average                                83                               +6.9%
NOTE: Mechanical trading model signals define the implied bias of the price index based upon moving average relationships, but they do not necessarily call for a specific action. They are information flags that should prompt chart review. Further, they do not call for continuous buying or selling during the life of the signal. For example, a BUY signal will probably return the best results if action is taken soon after the signal is generated. Additional opportunities for buying may be found as price zigzags higher, but the trader must look for optimum entry points. Conversely, exit points to preserve gains (or minimize losses) may be evident before the model mechanically closes the signal.
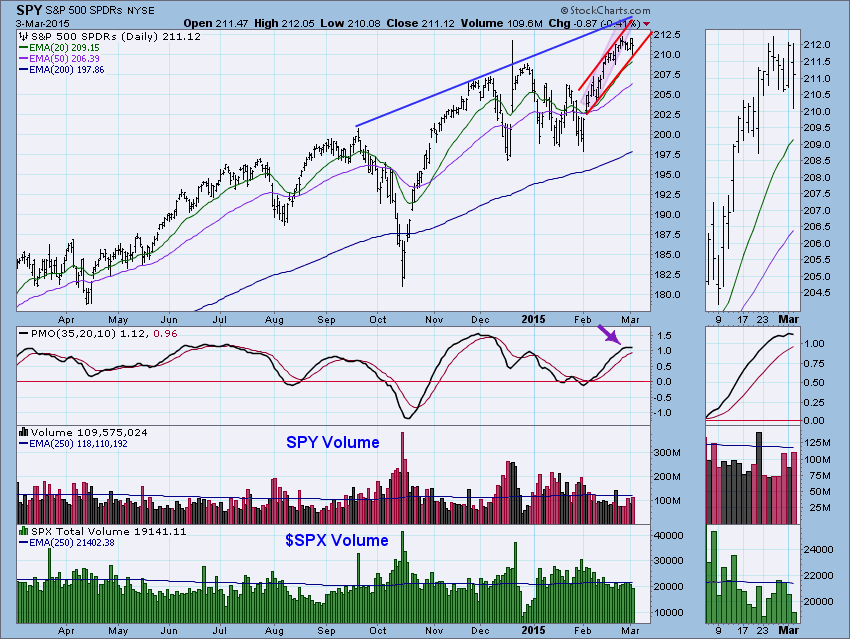
STOCKS: Based upon a 10/31/2014 Trend Model BUY signal, our current intermediate-term market posture for the S&P 500 (SPY) is bullish. The Trend Model, which informs our long-term outlook, is on a BUY signal as of 10/31/2014 so our long-term posture is bullish.
The previous steeply rising trend channel was broken and a new less accelerated rising trend channel was established as price successfully tested the lower boundary of this new channel. The PMO has attempted to top once again in somewhat overbought territory which is bearish in the short to medium term.
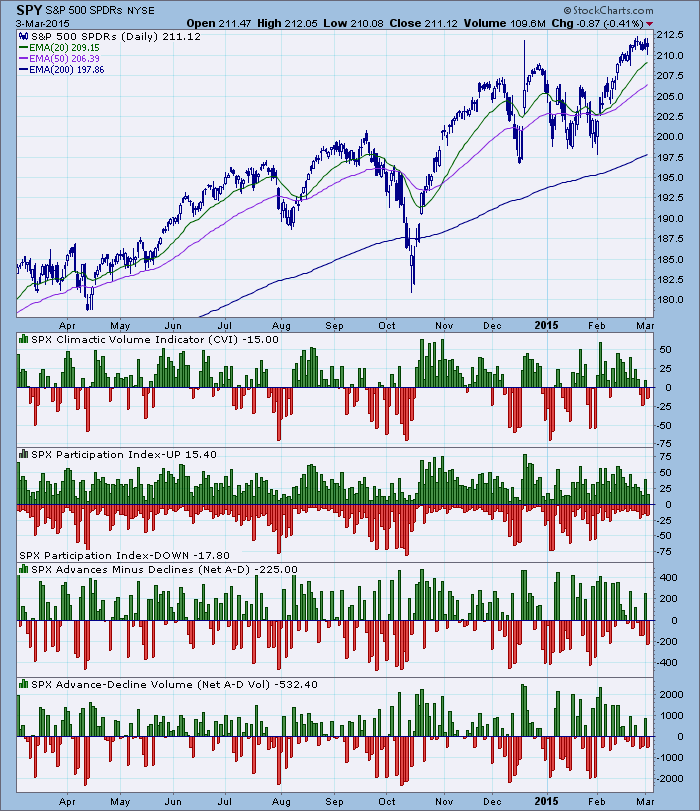
Ultra-Short-Term Indicators: The CVI has a more negative slant but readings were not what you would call 'climactic', as was the case with the other ultra-short-term indicators. This leaves us with a neutral stance in the ultra-short term.
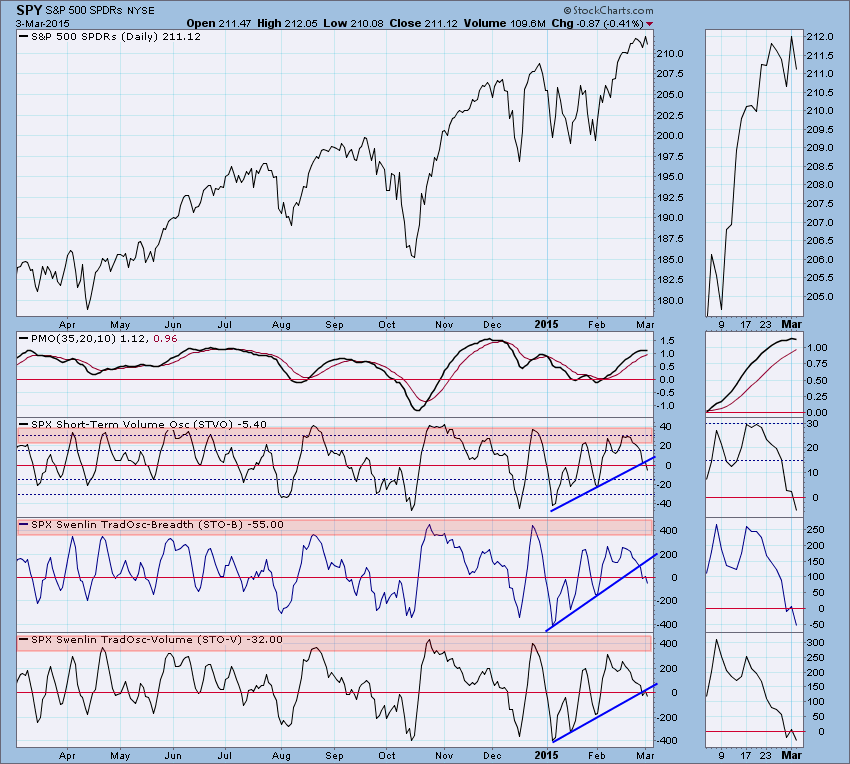
Short-Term Indicators: Not only have short-term indicators broken out of their rising trends, they have again topped which is all very bearish.
Intermediate-Term Indicators: The ITBM and ITVM are approaching negative crossovers their EMAs which is extremely bearish. The VTO did turn up slightly but it remains in overbought territory which is bearish.
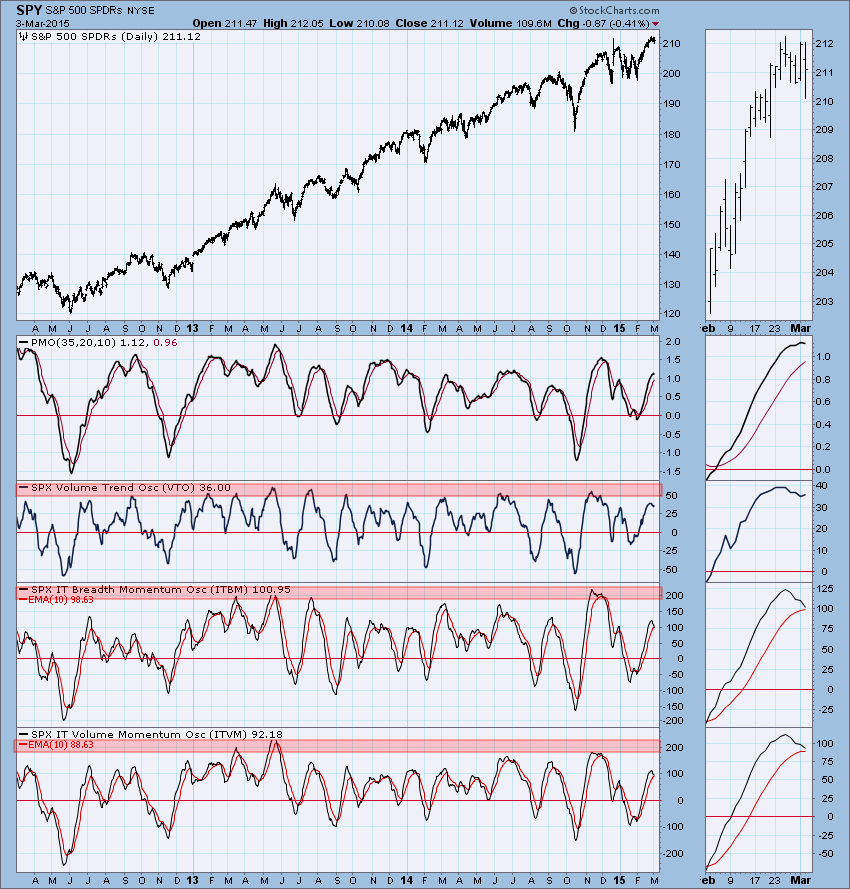
Conclusion: The market has established a new rising trend channel that is less dramatic than the previous which is good news. The bad news is that indicators in the short- and intermediate-term are very negative and suggest that a correction is needed which means the new rising trend channel will likely give way.
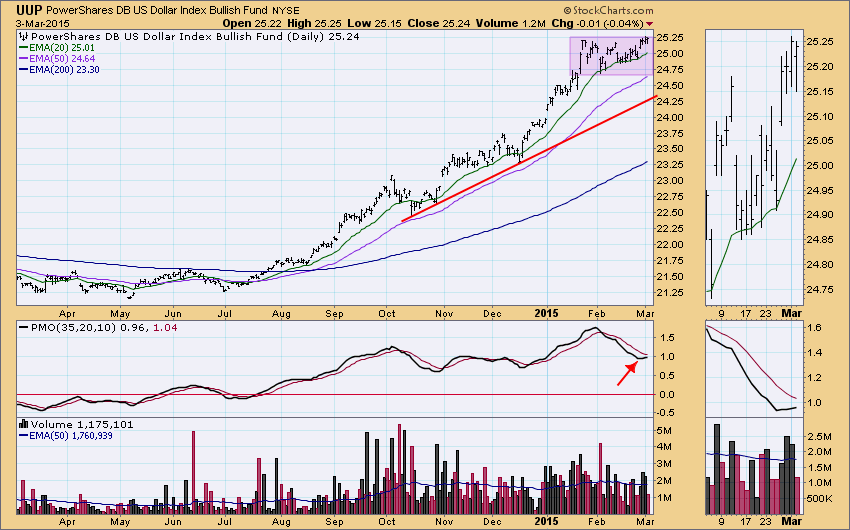
DOLLAR: As of 7/21/2014 the US Dollar Index ETF (UUP) is on a Trend Model BUY signal. The LT Trend Model, which informs our long-term outlook, is on a BUY signal as of 8/21/2014, so our long-term posture is bullish.
The dollar continues to consolidate in an ever lengthening rectangle chart pattern. These are typically continuation patterns so we would expect price to break out not break down. The PMO suggests that may happen soon as it has bottomed and is headed for a crossover BUY signal.
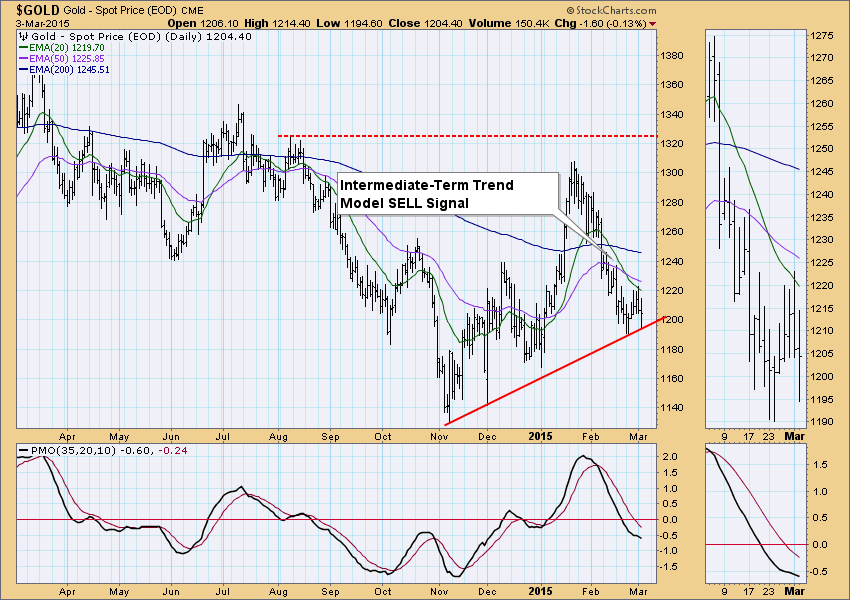
GOLD: As of 2/23/2015 Gold is on a Trend Model SELL signal. The LT Trend Model, which informs our long-term outlook, is on a SELL signal as of 2/15/2013, so our long-term posture is bearish.
Gold successfully tested support again despite the recent intermediate-term Trend Model SELL signal that was generated when the 20-EMA crossed below the 50-EMA while the 50-EMA was below the 200-EMA. The PMO was attempting to make a bottom, but instead, began to accelerate downward. The PMO is in neutral territory so there is plenty of room for it to move lower before becoming oversold.
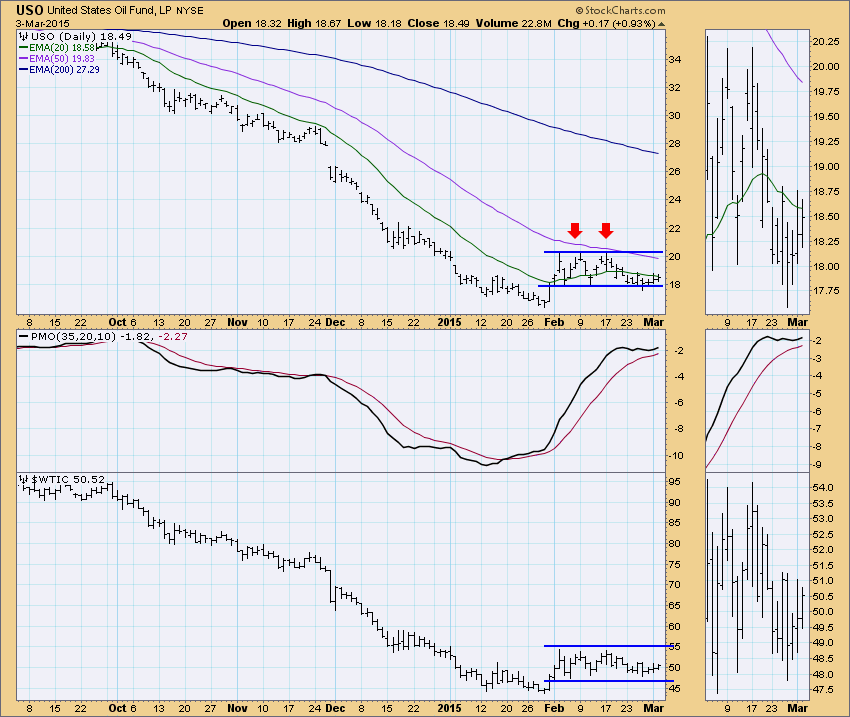
CRUDE OIL (USO): As of 7/30/2014 United States Oil Fund (USO) is on a Trend Model NEUTRAL signal. The LT Trend Model, which informs our long-term outlook, is on a SELL signal as of 8/28/2014, so our long-term posture is bearish.
Similar to the dollar, USO is consolidating in a rectangular continuation pattern. Inside the rectangle we see a double- or triple-top which is bearish and also suggests price will continue lower. The PMO is very overbought but did turn up which is positive.
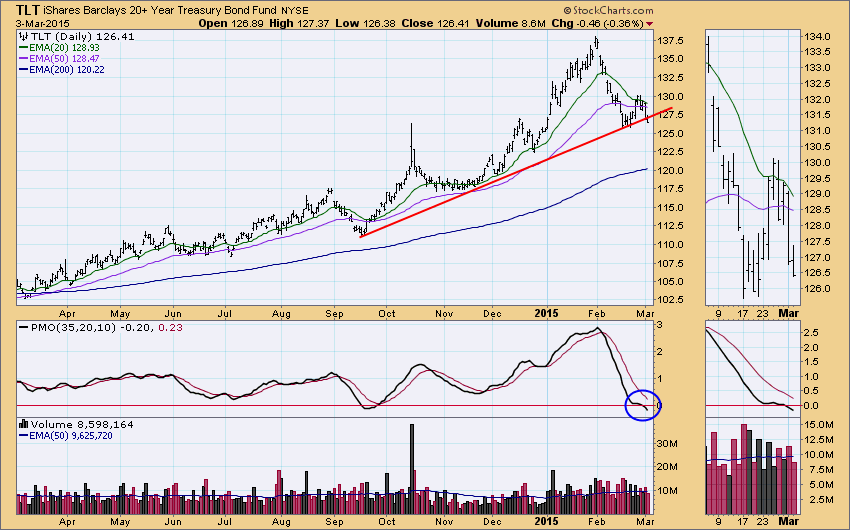
BONDS (TLT): As of 1/17/2014 The 20+ Year T-Bonds ETF (TLT) is on a Trend Model BUY signal. The LT Trend Model, which informs our long-term outlook, is on a BUY signal as of 3/24/2014, so our long-term posture is bullish.
TLT declined sharply on Friday and continued lower today causing price to break down slightly below rising bottoms support. The PMO topped below its EMA which is very bearish, especially given that the PMO is now reading below zero.
Technical Analysis is a windsock, not a crystal ball.
Happy Charting!
- Erin


