Standard & Poors finalized 2014 Q4 earnings on Thursday, and I like to review the numbers and the earnings chart. (Note that earnings are reported during the three months following the end of each quarter.) First we have an excerpt from the DP Overview of Market Fundamentals Report which we publish daily. Based upon the estimates we can see that there is some improvement expected in earnings by the end of this year.
*************************** S&P 500 FUNDAMENTALS ****************************

The real P/E for the S&P 500 is based on "as reported" or GAAP earnings
(calculated using Generally Accepted Accounting Principles), and it is the
standard for historical earnings comparisons. The normal range for the GAAP
P/E ratio is between 10 (undervalued) to 20 (overvalued).

Market cheerleaders invariably use "pro forma" or "operating earnings,"
which exclude some expenses and are often deceptively optimistic.

The following are the most recently reported and projected twelve-month
trailing (TMT) earnings, quarterly earnings, and price/earnings ratios (P/Es)
according to Standard and Poors.

                                             Est       Est       Est       Est
                               2014 Q4   2015 Q1   2015 Q2   2015 Q3   2015 Q4
TMT P/E Ratio (GAAP).......:     20.39     20.39     20.35     20.05     18.67
TMT P/E Ratio (Operating)..:     18.46     18.55     18.59     18.44     17.62
TMT Earnings (GAAP)........:    102.31    102.30    102.52    104.03    111.75
TMT Earnings (Operating)...:    113.02    112.44    112.23    113.12    118.37

QTRLY Earnings (GAAP)......:     22.83     24.86     27.36     28.98     30.55
QTRLY Earnings (Operating).:     26.76     26.74     29.13     30.49     32.01


Based upon projected GAAP earnings the following would be the approximate
S&P 500 values at the cardinal points of the normal historical value range.
They are calculated simply by multiplying the GAAP EPS by 10, 15, and 20:

                                             Est       Est       Est       Est
                               2014 Q4   2015 Q1   2015 Q2   2015 Q3   2015 Q4
Undervalued (SPX if P/E = 10):    1023      1023      1025      1040      1118
Fair Value  (SPX if P/E = 15):    1535      1535      1538      1560      1676
Overvalued  (SPX if P/E = 20):    2046      2046      2050      2081      2235
Next, let's look at the P/E Range Chart. It has a series of dotted lines which show where the S&P 500 Index would be if it were overvalue (red), fair value (blue), and undervalue (green). Currently, the S&P 500 is slightly above the overvalue line, which was caused by a drop in earnings from the previous quarter. (Note that the three dotted lines have turned down.)
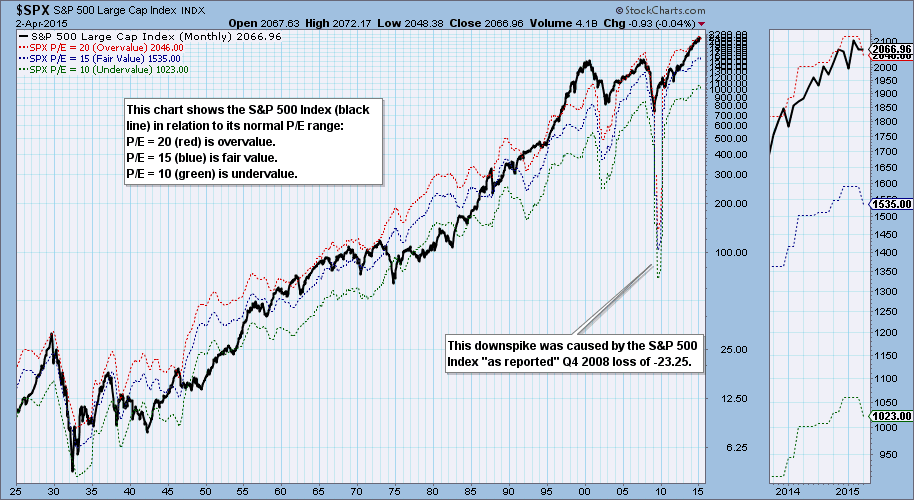
The 10 to 20 range is not sacrosanct, but it is an excellent indicator as to when market fundamentals are supporting or undermining the market. The currently overvalued condition of the market makes the market much more vulnerable to decline than if, say, prices were below the the undervalue green line.
Conclusion: As technicians we are not focused on fundamentals as we are on the technical condition of the market; however, maintaining an awareness of fundamentals can help us decide how much risk we are willing to take.


