Everyone is bandying around the term, "Sell in May, Go Away". But how true is it? Given we are seeing bearish patterns on the SPY, overhead resistance has held on strongly, long-term indicators are bearish and it's the end of May; it makes sense that the phrase is popular right now. Tom McClellan talked about this phrase in his last "McClellan Report". He did some trend research on Google searches on that phrase which showed there was more interest than normal in the phrase this year.
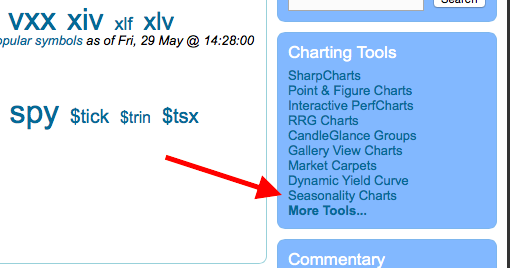
Fortunately on StockCharts.com we have the Seasonality Tool to test the hypothesis. You'll find the seasonality tool on the right-hand side of the StockCharts.com homepage. Or you can click this link and get there directly.
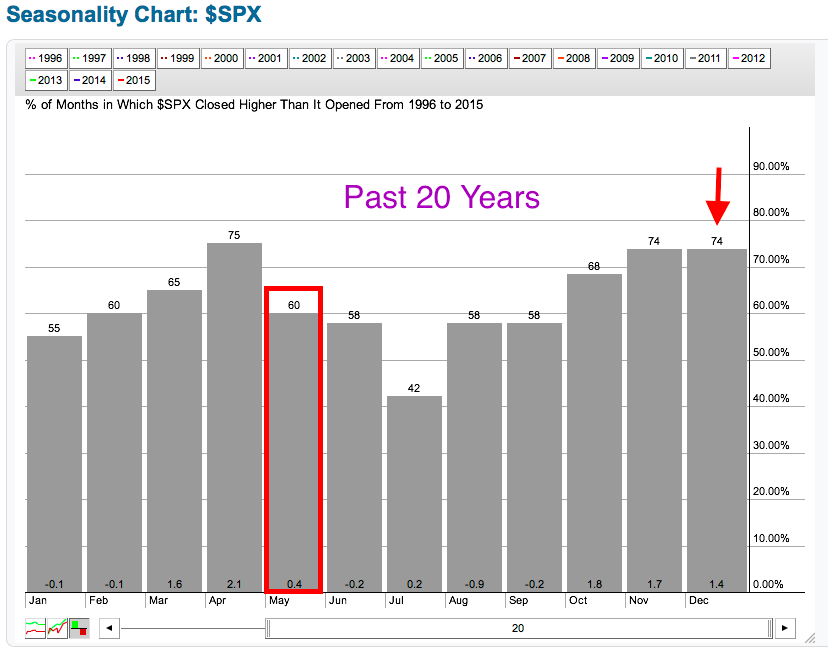
I decided to make two charts showing monthly selling across 20 years and 10 years. The results were very interesting. However in all cases, May, while not as good a month as others, was not the laggard.
Over the past 20 years, compared to April, which does the best, selling in May is pronounced in comparison. What's interesting is that after May, there is a continuation of selling until August. So it appears it takes a bit longer to 'go away'...by the end of summer buying is starting back up. I also pointed out December to make comparisons regarding the "Santa Claus Rally". Buying is definitely on the high side in December, but November is right up there with it.
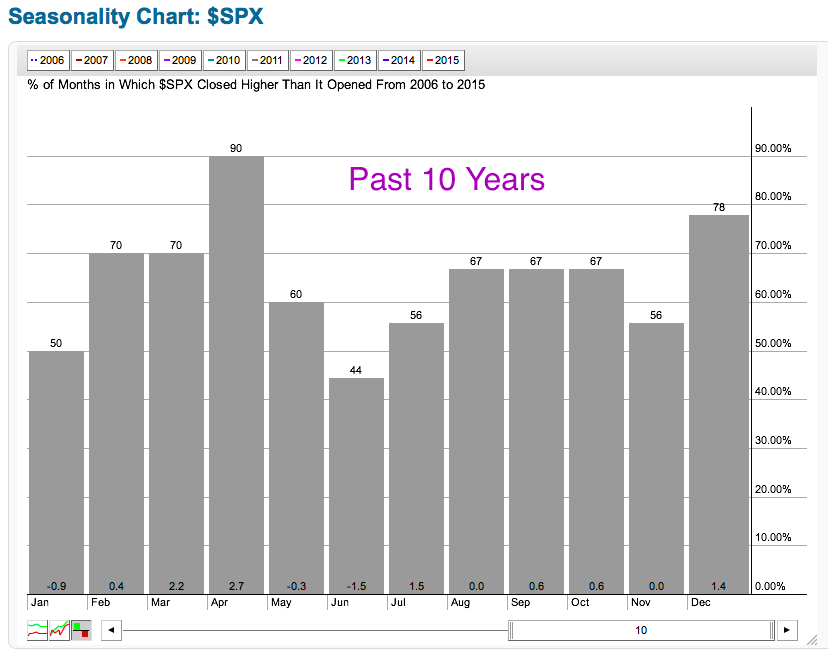
In the past 10 years, the "Santa Claus Rally" has held up 78% of the time. What is most shocking on this chart is that in the past 10 years, April has closed higher 90% of the time! When May follows, the selling is prominent when you compare April to May, so the phrase "Sell in May" holds up fairly well. June was worst but unlike the 20 year chart, buying starts back up sooner, in July. And, check out December! In recent times it does appear that Santa Claus does come to town in December.
It's important to note, a sample size of 10 and 20 years is very small mathematically to test the hypothesis fully, but the results seem to show that the phrase is somewhat correct and truer in the past ten years. With seasonality, it is important to remember that historical tendencies should not be used solely for trading decisions. We should be aware of the tendency, but act on actual price movement. Always look at the charts!
Happy Charting!
Erin


