We gave our webinar viewers a sneak peek at the new scoreboard and now it is LIVE! A picture of the SPX scoreboard is below:
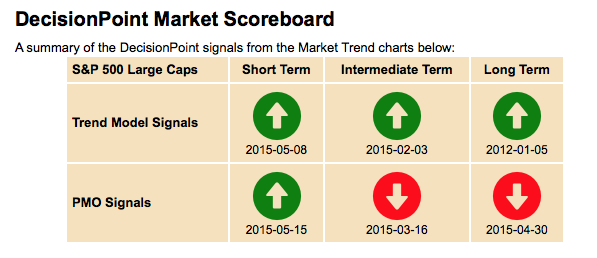
For members, there is a drop-down menu on the side where you can switch between the NDX, OEX and DJIA. You'll find the date that the signal changed below the directional arrow. But what do they mean exactly?
DecisionPoint has two "signal generators", the Trend Model and the Price Momentum Oscillator (PMO). The Trend Model measures what is happening with price trends as the name suggests. The first part of the DecisionPoint analysis approach is to determine the trends. To do that we measure positive and negative crossovers between the 5/20/50/200-EMAs. Depending on your time frame you use the positions of these EMAs to determine the signals that are noted on the scoreboard.
Let's look at the Trend Model signals:
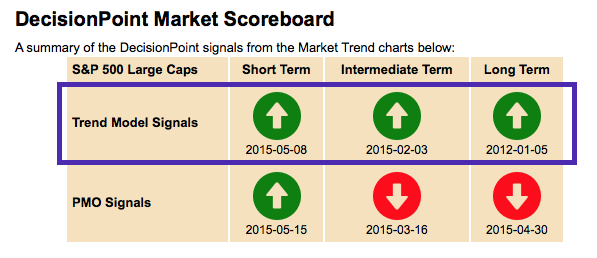
Long-Term Trend Model signals are generated with 50/200-EMA crossovers. If the 50-EMA is above the 200-EMA, the long-term Trend Model signal is UP (bullish) because the 50-EMA is above the 200-EMA.
Intermediate-Term Trend Model signals are generated with 20/50-EMA crossovers in relation to the 200-EMA. Any time the 20-EMA is above the 50-EMA it's UP (buy), however, if it crosses below the 50-EMA it is either a Neutral ("--") if the 50-EMA is above the 200-EMA, or a DOWN if the 50-EMA is below the 200-EMA when the negative crossover occurs.
Short-Term Trend Model signals are generated with the 5/20-EMA crossovers in relation to the 50-EMA. Same as above for these signals.
So, the Trend Model determines price trends. The second half of the scoreboard is the second part of our Analysis Approach. We want to know the 'condition' of price...that is, internal weakness or strength based on the PMO.
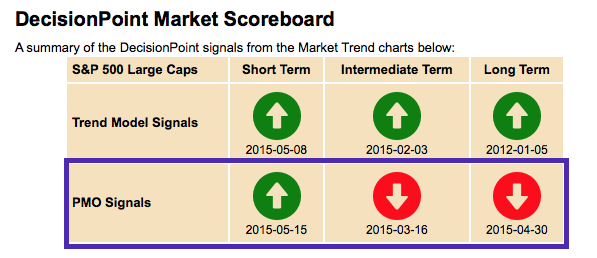
Short-Term PMO signals are determined by PMO crossovers its signal line on the DAILY charts. The Intermediate-Term PMO signals are generated by the WEEKLY PMO and Long-Term PMO signals are generated on the MONTHLY chart using the monthly PMO crossovers. There will only be an UP arrow or DOWN arrow because there are no "neutral" signals for the PMO.
Now that you know what each "score" means you can get a quick visual on market strength and weakness based on both Trend and Momentum (condition). Tune in to my next webinar to learn more! Or check out the recording of my last webinar where I review in detail how the signals are determined for the scoreboard. I'll be reviewing the scoreboard on this week's webinar too!
Happy Charting!
Erin
** Technical analysis is a windsock, not a crystal ball **
