I'm alerted whenever there is a Short-Term Trend Model signal change on the major indexes. In fact, I downloaded the "StockCharts Essentials" ChartPack and I run my alerts on the "1010 Essential Major Market Indexes" ChartList in particular. The alert scan is included below:
[favorites list is 24] // 1010 Essential Major Market Indexes
AND [today's ema(5,close) > today's ema(20,close)]
AND [yesterday's ema(5,close) < yesterday's ema(20,close)]
OR
[[favorites list is 24] // 1010 Essential Major Market Indexes
AND [today's ema(5,close) < today's ema(20,close)]
AND [yesterday's ema(5,close) > yesterday's ema(20,close)]]
You can simply change the "1010" ChartList to one of your own. I do not recommend using this scan on the near infinite universe that is the StockCharts.com database; pick your own ChartList or narrow it down to a sector, index or other smaller universe. I'll be sure to cover how it works in this week's DecisionPoint LIVE! After Dark webinar, so sign up now!
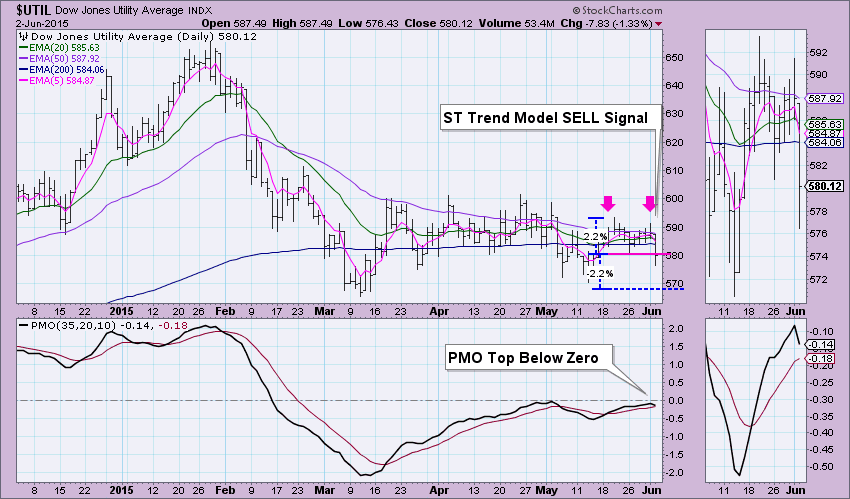
Let's look at $UTIL first. There are plenty of things wrong with this picture. First, is the ST Trend Model SELL signal that was generated when the 5-EMA crossed below the 20-EMA while the 20-EMA was BELOW the 50-EMA. The Intermediate-Term Trend Model has actually been on a Neutral signal since the 20-EMA crossed below the 50-EMA back in February which has kept a bearish backdrop on all the various 5/20-EMA crossovers that occurred on the ST Trend Model since then. Next there is the chart pattern, a bearish double-top that executed today when price broke below the neckline. I've graphically noted how the minimum downside target is calculated which equates to a move to at least 568 or 569. Support lies just under that at the March low, so I wouldn't want to project past that area of support. The Price Momentum Oscillator (PMO) top below zero is very bearish but a PMO SELL signal hasn't been generated just yet.
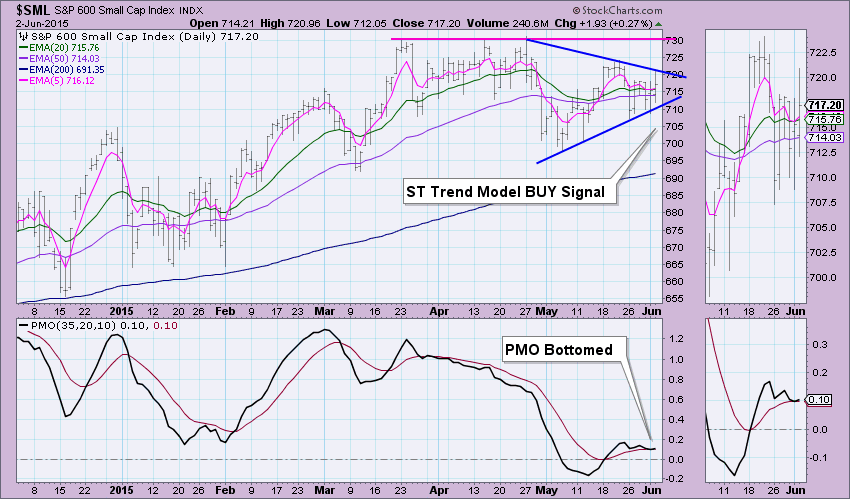
The chart pattern on the $SML chart is ambiguous. I see in blue, a symmetrical triangle. Unfortunately these patterns can break in either direction, so we need more information. You could make a case for an ascending triangle. These are bullish and are formed by a horizontal resistance line and a rising bottoms trendline. In this case, the pink line for the horizontal and the blue rising bottoms line for the base of the pattern. Since that pattern is bullish in nature, I would expect price to break out from the symmetrical triangle and reach toward overhead resistance. The Short-Term Trend Model BUY signal supports this hypothesis. The PMO bottom is bullish as well. The PMO reading was nearly the same as its signal line the past few days. The label is only goes to two decimal places. Using an animation technique of selecting "Custom Start/End" date on the charting workbench and ticking back a few days (I'll show you this on Wednesday too!), I could tell that this was a bottom. There may have been a negative crossover SELL signal, but that isn't important, it would've been a whipsaw signal anyway. What is important is that there was a PMO bottom.
Be sure to sign up for tomorrow's DecisionPoint LIVE! webinar where I will give you the details on all of our current timing signals as well as demonstrate setting up Alert scans and "animating" your charts.
Technical Analysis is a windsock, not a crystal ball.
Happy Charting!
- Erin


