 In my last article, I explained how I set up StockCharts.com Technical Alerts to email me when any Trend Model or Price Momentum Oscillator (PMO) signal changes occur. I started it so that I could keep our DP Scoreboard up to date, but I'm finding it to be a great tool to also see which of the major indexes and sectors are generating the Short-Term Trend Model signals. The Short-Term Trend Model generates a BUY signal any time the 5-EMA crosses above the 20-EMA. If the 5-EMA crosses below the 20-EMA, it is a Neutral if the 20-EMA is above the 50-EMA and a SELL if it is below the 50-EMA. So here is the listing:
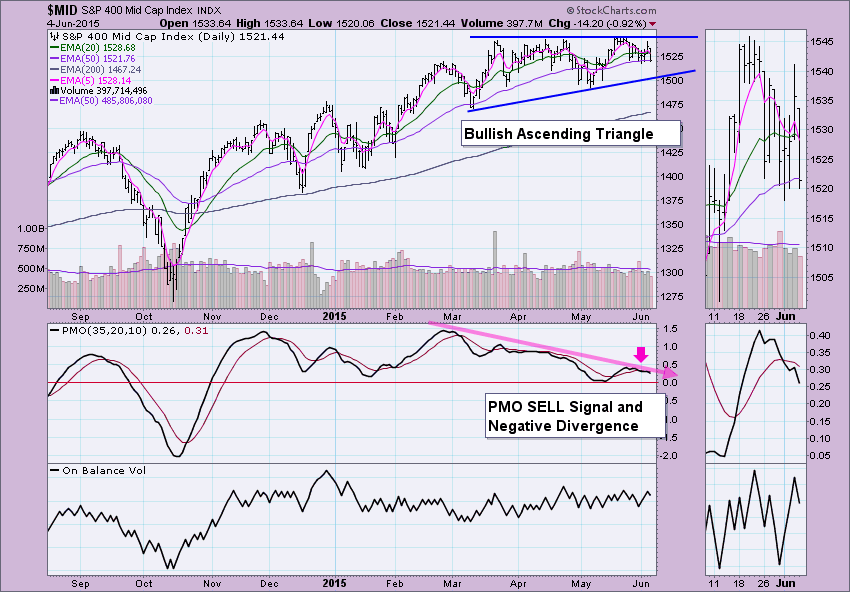
$MID - S&P 400 - ST Trend Model Neutral
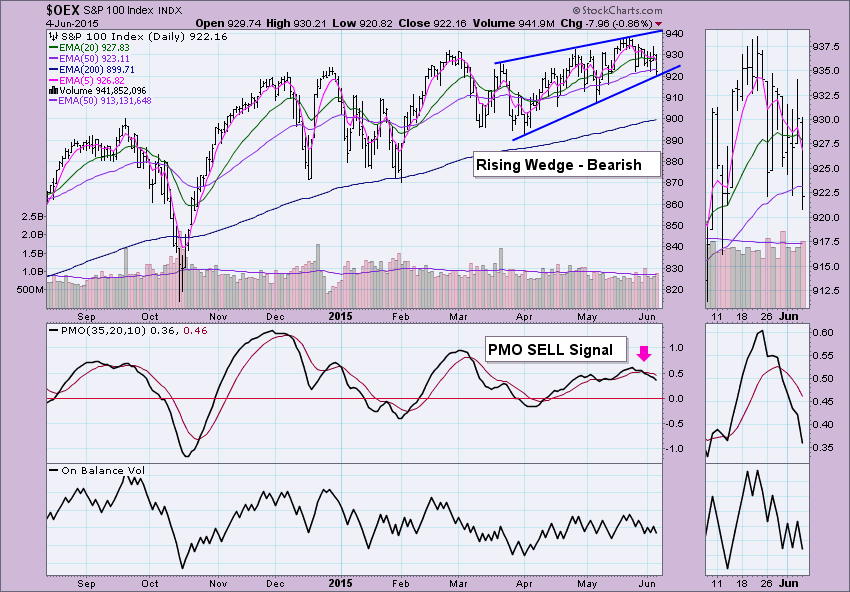
$OEX - S&P 100 - ST Trend Model Neutral
$RUA - Russell 3000 - ST Trend Model Neutral
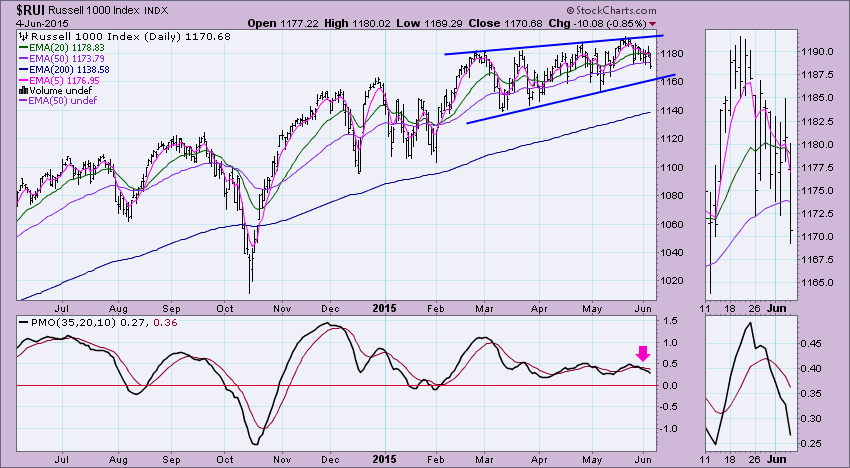
$RUI - Russell 1000 - ST Trend Model Neutral
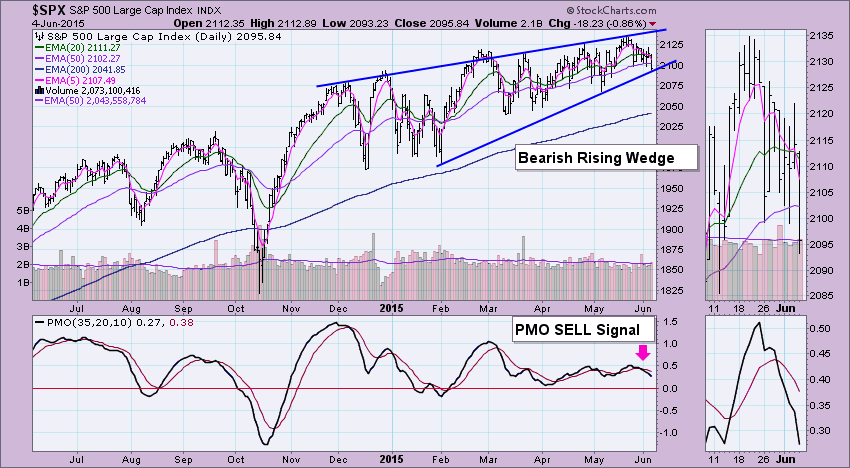
$SPX - S&P 500 - ST Trend Model Neutral
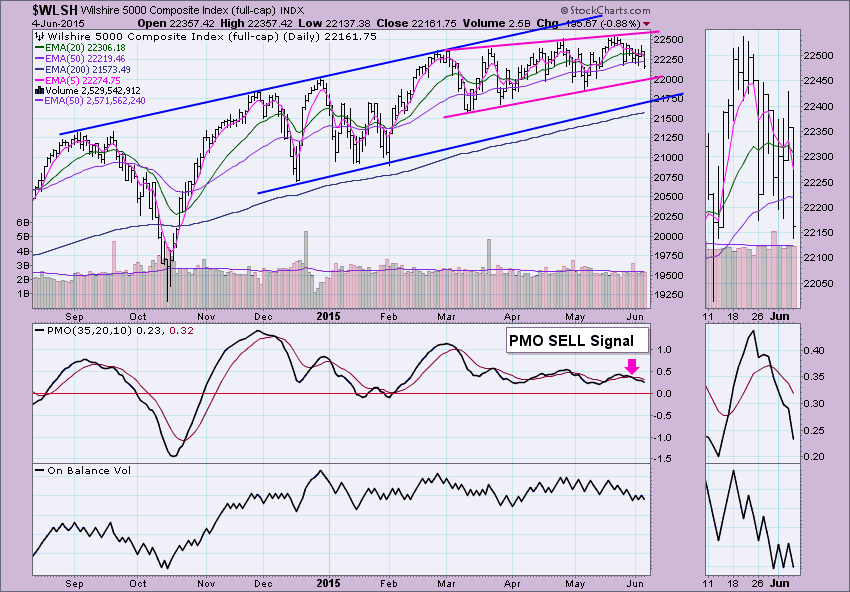
$WLSH - Wilshire 5000 - ST Trend Model Neutral
Notice this is a list not just comprised of small caps or large caps, it is a combination of both, which is bearish for the market overall in the short term; "short term" meaning days or weeks. It appeared earlier this week that small caps would lead the way since we got a Short-Term Trend Model BUY on the S&P 600 (see my article here). Their charts have not been as pessimistic, but now is a somewhat different story. Below is a quick analysis. They are mostly the same, but the $MID and $WLSH chart have a few bullish features among the bearish evidence.
In actuality, I believe this is the more 'bullish' of the charts because the pattern is more of an ascending triangle rather than rising wedge (i.e. horizontal top vs. rising trendline). Unfortunately, the PMO SELL signal, negative divergence between the PMO and price, and the current Short-term Trend Model Neutral signal.
With the following charts, you'll see the bearish rising wedge as well as a PMO SELL signal in effect. The PMO readings are falling, implying positive momentum is continuing to dry up. Be sure to check out the thumbnail so that you can see the 5/20-EMA negative crossover that generated the Neutral signals.
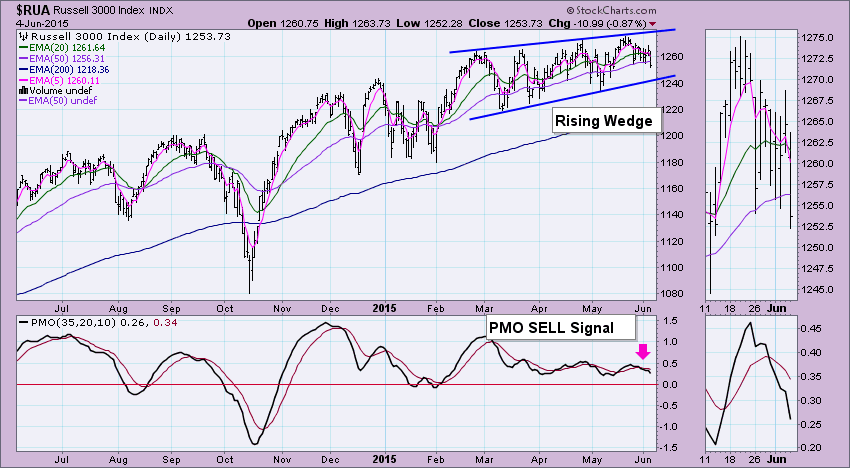
The final chart is interesting in that it was the only one that I was able to trace a clear rising trend channel (blue). That's bullish for the intermediate term. However, in the short term, like the others, there is a rising wedge pattern (pink), albeit a slowly closing one. The PMO SELL signal is in effect and the PMO is sinking slowly. A breakdown from the wedge that hits the bottom of the rising trend channel seems plausible.
Technical Analysis is a windsock, not a crystal ball.
Happy Charting!
- Erin


