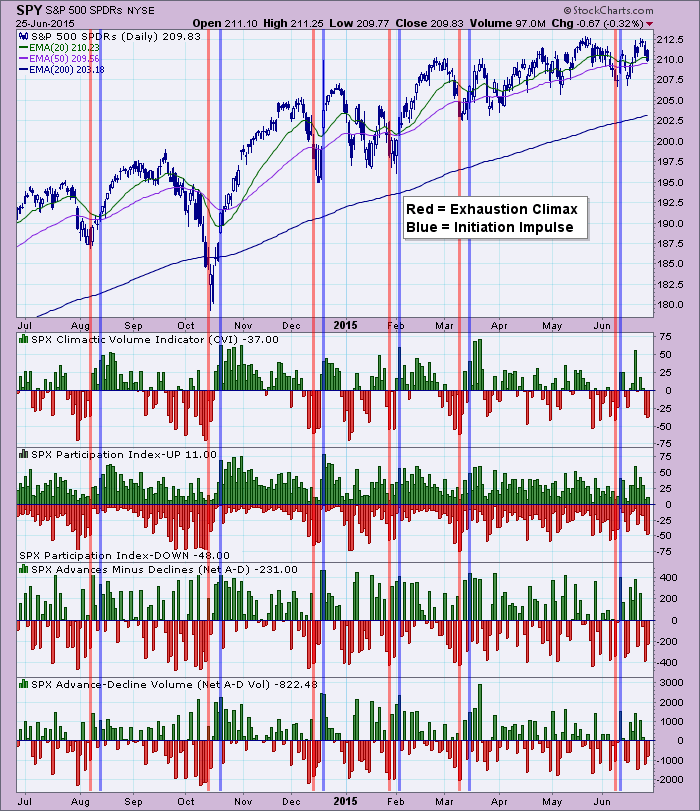
 In today's DecisionPoint Alert, I warned of very bearish readings appearing on our shorter-term indicators. When these indicators get very elevated readings in either direction, it is an attention getter. Climactic readings, as we call them at DP, can be an indication of an "exhaustion" of the current move or an "initiation" to more follow-through on the current move. The indicators in question are the ultra-short-term Climactic Volume Indicator (CVI) and Participation Index, and the short-term Swenlin Trading Oscillator - Breadth (STO-B), Swenlin Trading Oscillator - Volume (STO-V) and the Short-Term Volume Oscillator (STVO). You'll find them all in ChartSchool; I linked them to their particular article for reference.
The CVI and Participation Index - DOWN spiked today and yesterday as well. Yesterday's reading was clearly an initiation impulse since we saw follow-through on yesterday's decline (hindsight being 20/20, of course). I've annotated a few exhaustion and initiation climaxes on the ultra-short-term indicator chart below. Note: Just because I've used a RED line to annotate exhaustion climaxes, they aren't always an exhaustion of a down move. BLUE lines are initiation impulses, but they also work in either direction.
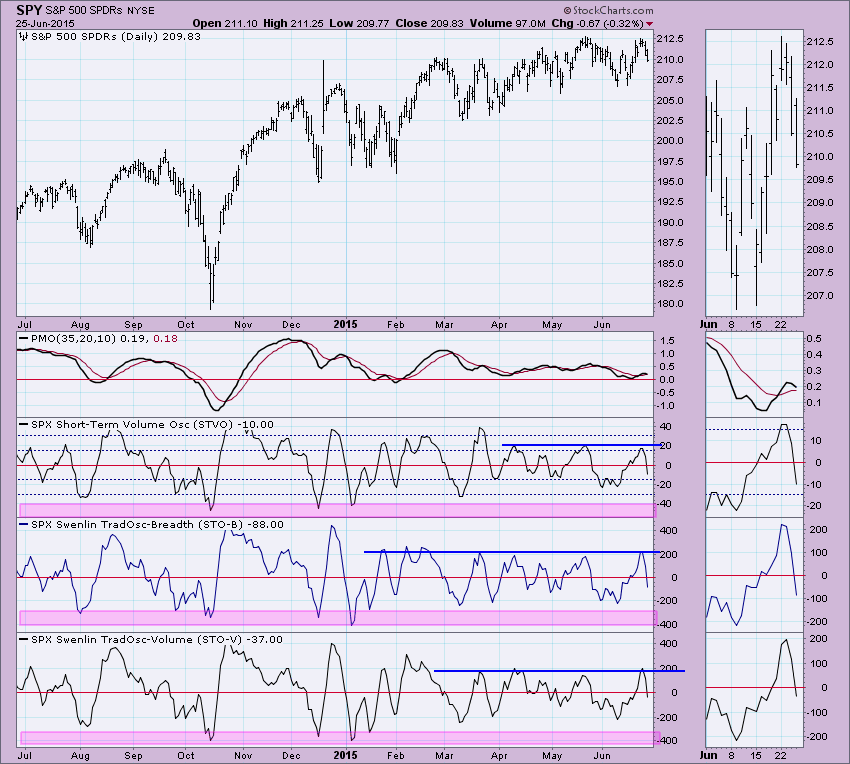
How fascinating is it that the indicators below have hit the "resistance" lines consistently? It was somewhat surprising to see how far these indicators moved today given that they have been slowly ticking and twitching along. This is what got my attention especially after seeing the climactic readings on the CVI and Participation Index - DOWN. I don't see this big drop to be an exhaustion. In the case of the STVO and STOs, we can watch for overbought/oversold conditions. Today's big move lower put readings in neutral territory. Short-term oversold territory is nearing but looking further back we see that actual oversold territory and oversold extremes are still far away enough to consider the current numbers to be neutral.
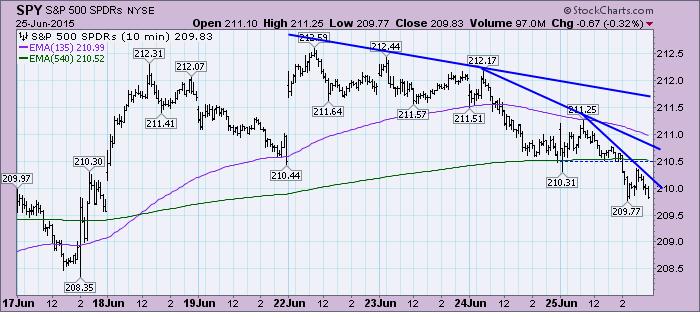
Looking at today's elevated readings it is hard for me to see them as exhaustion moves. Why? Look at the 10-minute bar chart below. Price is accelerating downward, not just falling...accelerating.
Fortunately, support isn't too far when you look at a daily chart for the SPY. This makes sense given that indicators, while bearish, could reach oversold territory fairly soon and support a bounce. The intermediate term is Neutral in my estimation. Be sure to read today's DecisionPoint Alert to get the run-down on the intermediate term indicators and the implications.
Technical Analysis is a windsock, not a crystal ball.
Happy Charting!
- Erin
