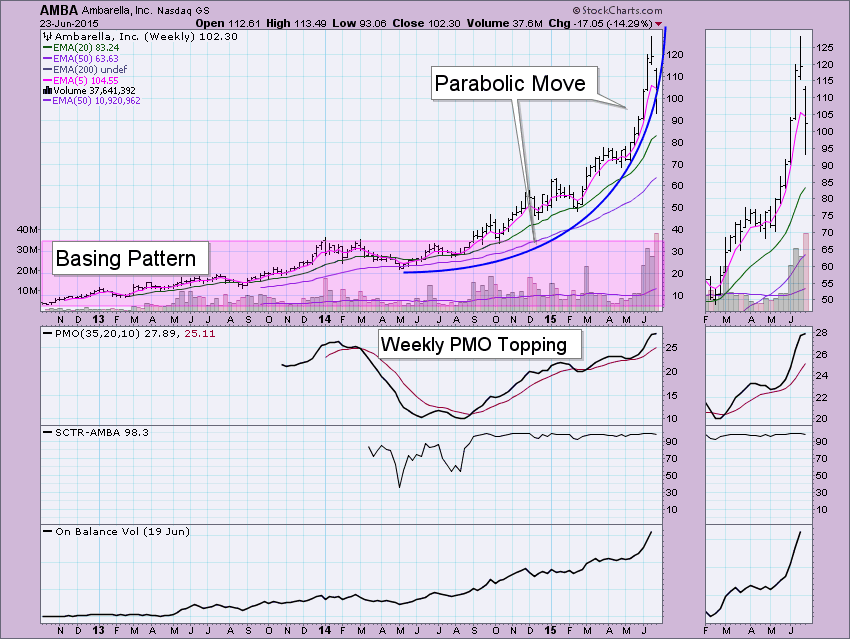
Did I not mention in my previous article "Picture Perfect: Ambarella" that AMBA was in a "jinx" situation or possible sentiment trap? It appears the cash cow is dying. Yes, it was up over 8% today, but it was down nearly 20% yesterday. Carl and I discussed the charts of Ambarella yesterday morning when the waterfall correction was in full swing. It appears we have a textbook parabolic breakdown. Look at the weekly chart for Ambarella (AMBA) below. The parabolic formation is obvious. When a parabolic price pattern begins to develop on a stock you own, you need to have your stops firmly in place (I was beyond thankful that I had mine yesterday). When a parabolic begins to fail, it generally crashes to earth quite quickly, so fast that many lose much of their gains even with a stop. Those who bought in late or eternal optimists or those who hate to sell anything at a loss are always left holding the bag. But how far should we expect AMBA to fall? Unfortunately, the expectation is for price to fall all the way to the basing pattern or trading range it was in before the parabola really got started. In the case of AMBA, that would be around $40. Ouch.
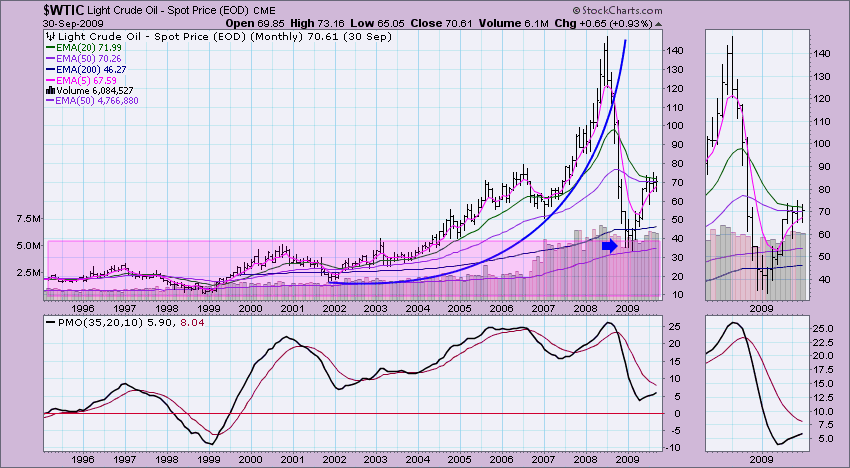
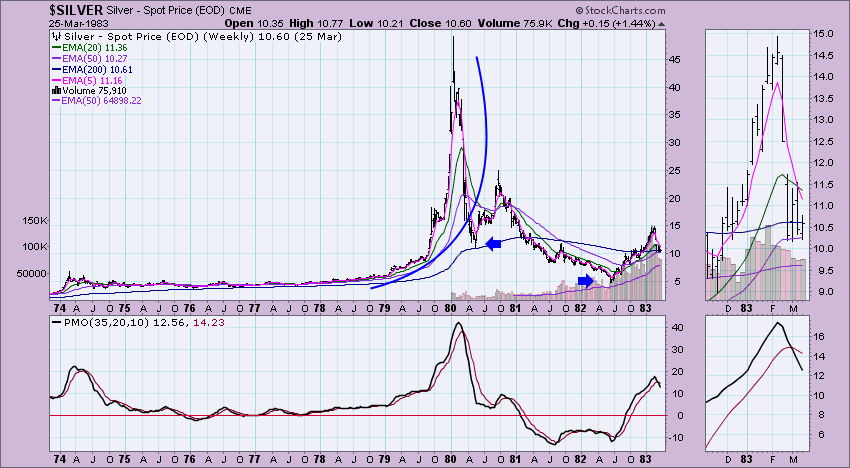
Here are two well-known examples of a parabolic pattern failure:
As I explained to a friend, those who got in early, before the rise, will eventually exit if given a reason. For AMBA, Citron Research released a report saying that it was "ridiculous" and in a "parabolic frenzy". That set the correction off. The drop should accelerate because all of those who got in early are bailing or getting stopped out to lock in profit. Then you have those who bought late that want to pare their losses. Between the two, they push price over a cliff. In between, like today, you'll find bargain hunters, but unless they are very savvy, they will get sucked into the correction. As an aside, the CFO and VP of Marketing both sold a combined 11,184 shares this month. Hmmmm.
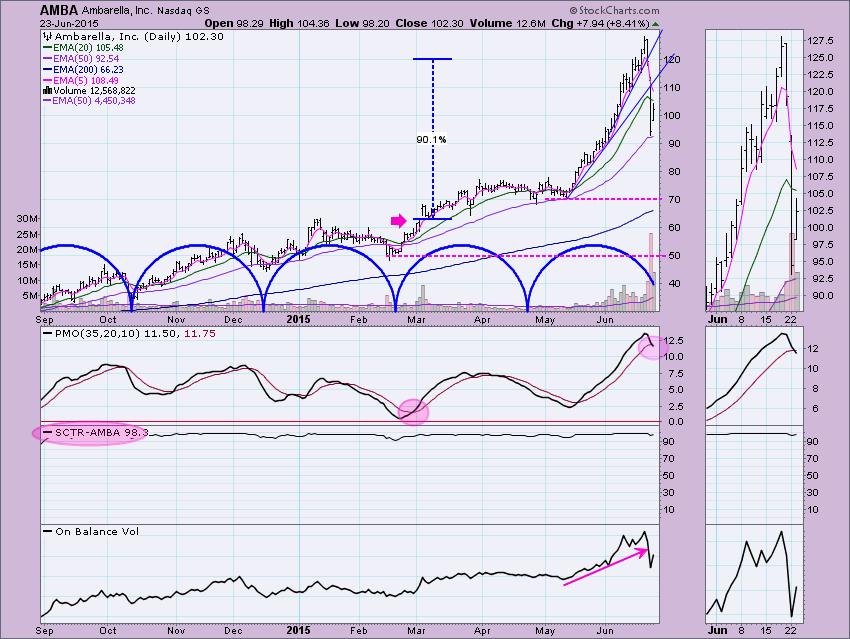
The daily chart for AMBA doesn't give me much reason to think that this will end nicely. The Price Momentum Oscillator (PMO) had a negative crossover its EMA today which generated a PMO SELL signal in extremely overbought territory. It is fascinating that the cycles seem right on, meaning there is more downside as the cycle trough has not come in yet. Both rising bottoms lines have been broken. Volume was definitely behind the drop. Today's volume was half of yesterday's on the bounce. The SCTR value hasn't been hurt and the Trend Model in all three time frames is on a BUY. Price did find support on the 50-EMA, but I suspect more folks will be attempting to cover losses or protect profit which will move price down further toward the original trading range around 40 and below. Best case scenario would be a successful test and bounce on support at around 70 or 50.
Technical Analysis is a windsock, not a crystal ball.
Happy Charting!
- Erin


