The DecisionPoint Scoreboard, located in the DP Chart Gallery, has been slowly flipping signals. Similarly we have seen a flip of Intermediate-Term Trend Model (ITTM) signals to Neutral or SELL. Typically when we see this type of movement of signals it is a sign of internal weakness in the market as a whole. Below is the current Scoreboard for each of the four indexes available in the Chart Gallery. (You need to be a paying member to see more than just the SPX).
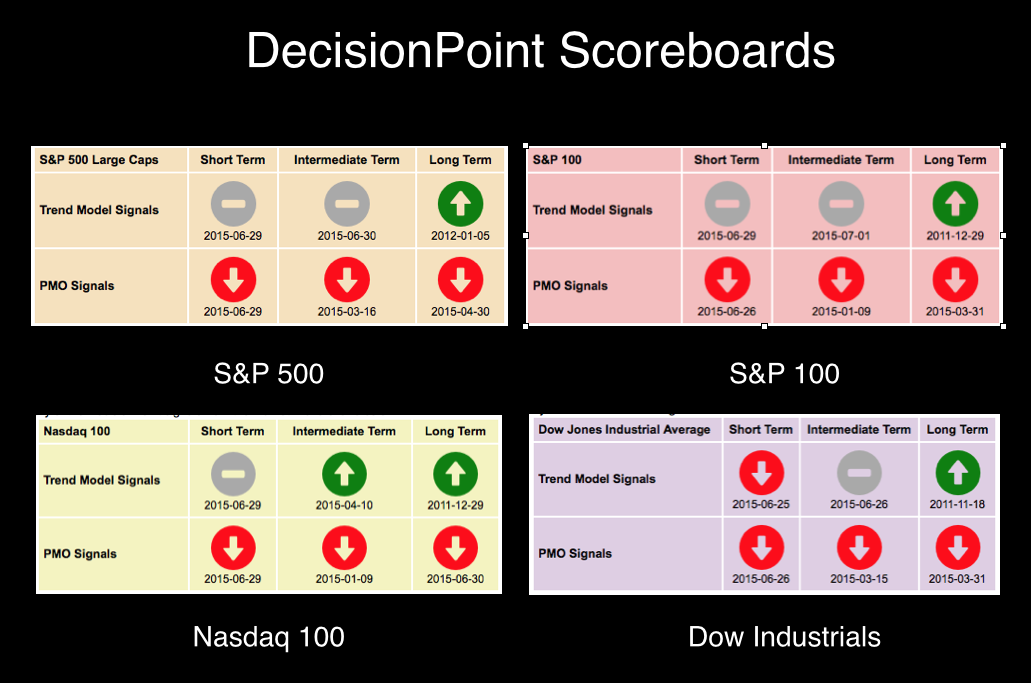
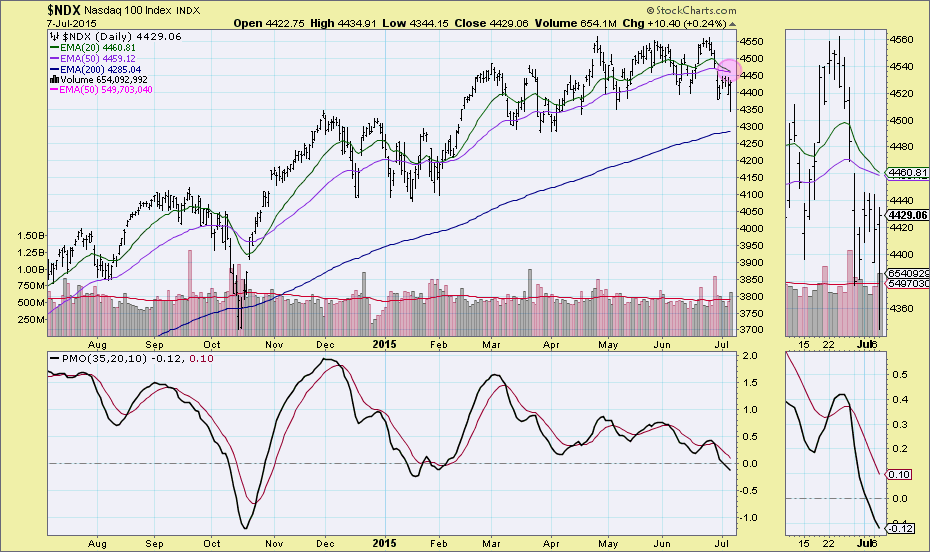
You'll note above that the NDX is the only one still on a BUY signal on the ITTM. However if you look at the NDX chart below from the Chart Gallery, you can see that an ITTM Neutral is nearing. A ITTM Neutral signal will activate when the 20-EMA crosses below the 50-EMA.
The DP Market/Sector Summary is the report that is published everyday in the DP Reports blog and what I publish an excerpt from in every DecisionPoint Alert blog article I write. Because I watch it everyday, I am able to watch the various ITTM signals change or not change as the case may be. Here is an excerpt from the DP Market/Sector Summary from April 20th. Note all of the BUY signals.
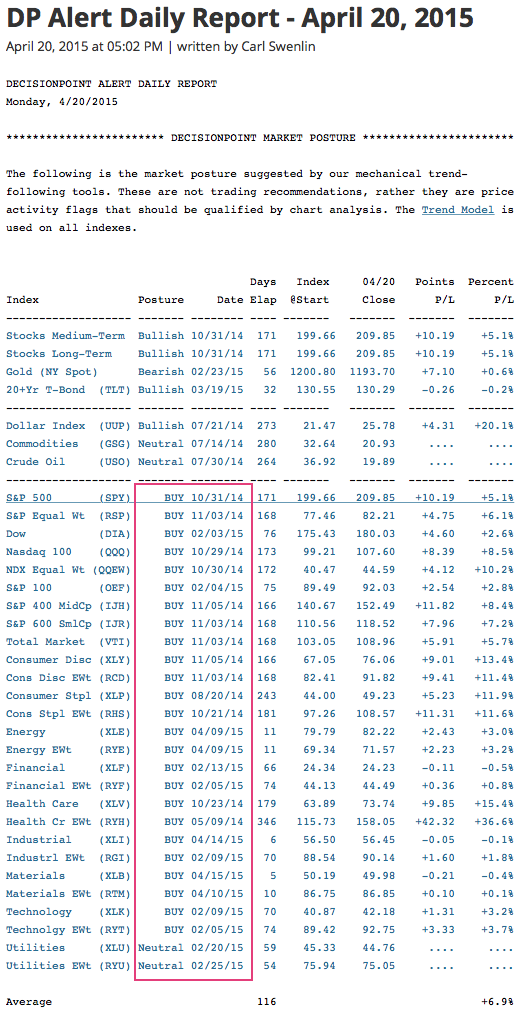
You'll see in today's Summary report the "flip" the table has made since then. This is a warning.
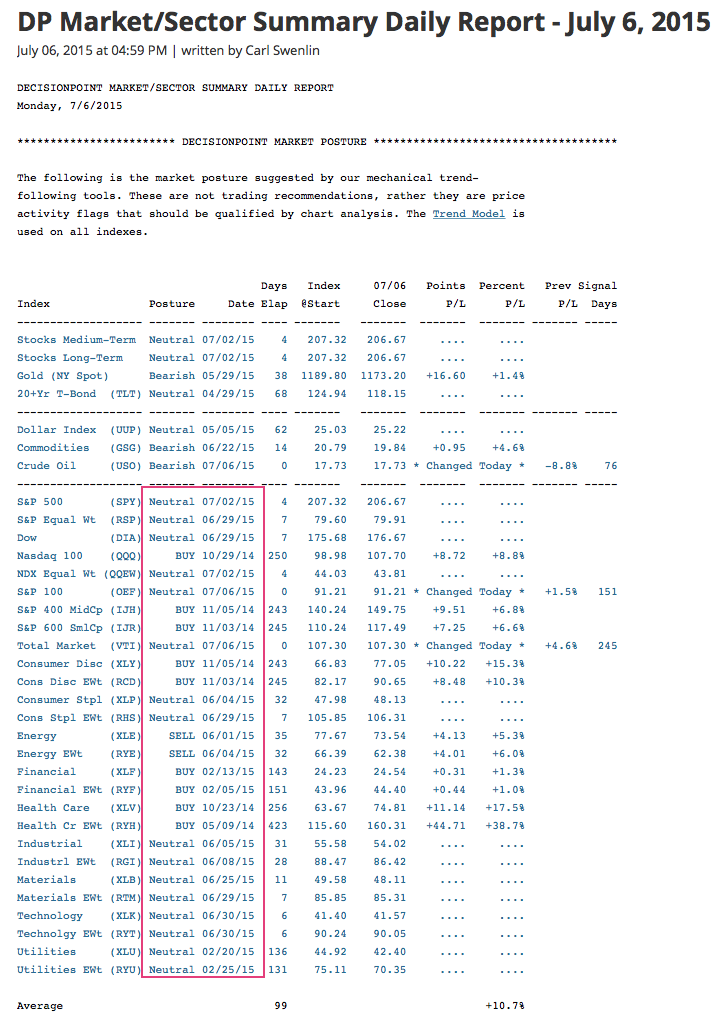
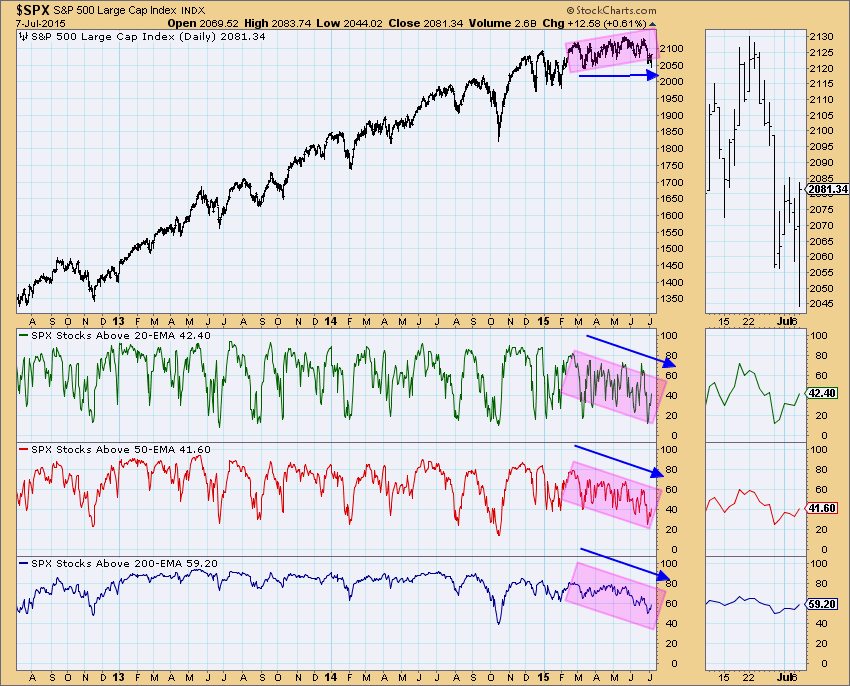
All of these examples tell us that the market is in decline and actually has been for some time internally. To determine how weak the market is internally and to measure the condition of the market (overbought/oversold), the Stocks Above Their 20/50/200-EMAs chart illustrates how the majority of stocks are not participating in correlation with price. The Stocks Above Their 200-EMA is the most stark example.
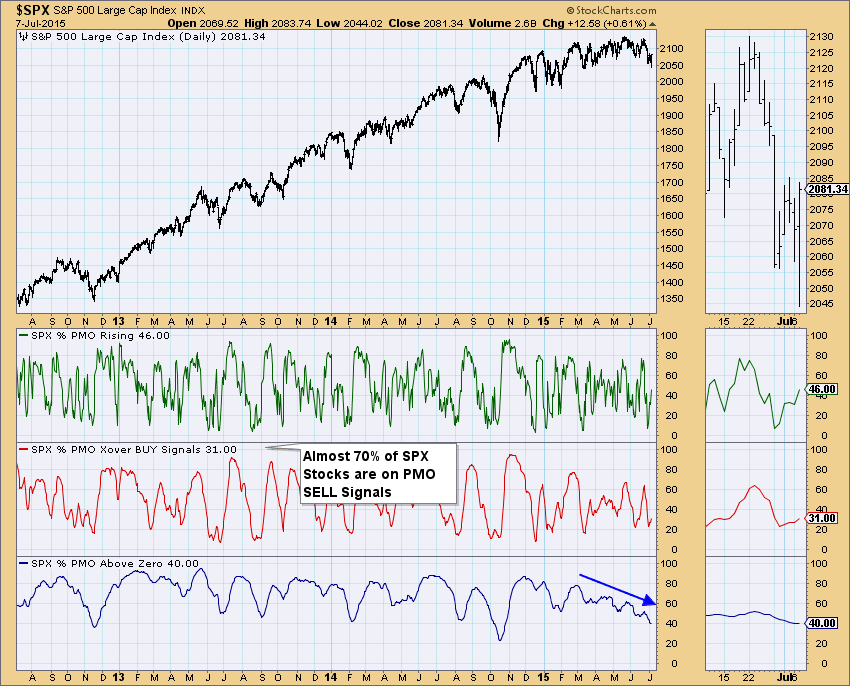
The Price Momentum Oscillator (PMO) Analysis chart shows that not only are their fewer stocks with values above zero and almost 70% of stocks in the S&P 500 are on PMO SELL signals. The PMO measures price momentum, positive and negative. Price momentum has been slipping since March.
For a more detailed view and analysis of the market, gold, the dollar, oil and bonds I recommend you check out my daily Alert in the DecisionPoint Alert blog. While you're at it, click on the subscribe button in the upper right-hand corner and you'll be alerted when I post a message in this free DecisionPoint blog.
Technical Analysis is a windsock, not a crystal ball.
Happy Charting!
- Erin
