 As I perused the DecisionPoint Market/Sector Summary found in the DP Reports blog, I noticed that there are still some very old Intermediate-Term Trend Model (ITTM) BUY signals. I wrote in my last DecisionPoint blog article, "DP Scoreboard, Market/Sector Summary and Participation Suggest Internal Weakness", that the ITTM table from the DP Market/Sector Summary had mostly "flipped" to Neutral or SELL signals. Well, let's take a look at the hangers-on and determine how much longer they have or if they are strong sectors after all. Here is the most recent ITTM table:
DECISIONPOINT MARKET/SECTOR SUMMARY DAILY REPORT
Thursday, 7/9/2015

************************ DECISIONPOINT MARKET POSTURE ***********************

The following is the market posture suggested by our mechanical trend-
following tools. These are not trading recommendations, rather they are price
activity flags that should be qualified by chart analysis. The Trend Model is
used on all indexes.


                                     Days   Index     07/09   Points  Percent
Index               Posture     Date Elap  @Start     Close      P/L      P/L
------------------- ------- -------- ---- -------   -------  -------  -------
Stocks Medium-Term  Neutral 07/02/15    7   207.32   204.80     ....     ....
Stocks Long-Term    Neutral 07/02/15    7   207.32   204.80     ....     ....
Gold (NY Spot)      Bearish 05/29/15   41  1189.80  1159.20   +30.60    +2.6%
20+Yr T-Bond  (TLT) Neutral 04/29/15   71   124.94   117.92     ....     ....
------------------- ------- -------- ---- -------   -------  -------  -------
Dollar Index  (UUP) Neutral 05/05/15   65    25.03    25.28     ....     ....
Commodities   (GSG) Bearish 06/22/15   17    20.79    19.98    +0.81    +3.9%
Crude Oil     (USO) Bearish 07/06/15    3    17.73    17.71    +0.02    +0.1%
------------------- ------- -------- ---- -------   -------  -------  -------
S&P 500       (SPY) Neutral 07/02/15    7   207.32   204.80     ....     ....
S&P Equal Wt  (RSP) Neutral 06/29/15   10    79.60    79.33     ....     ....
Dow           (DIA) Neutral 06/29/15   10   175.68   175.21     ....     ....
Nasdaq 100    (QQQ) Neutral 07/08/15    1   106.09   106.06     ....     ....
NDX Equal Wt (QQEW) Neutral 07/02/15    7    44.03    43.28     ....     ....
S&P 100       (OEF) Neutral 07/06/15    3    91.21    90.43     ....     ....
S&P 400 MidCp (IJH) Neutral 07/07/15    2   150.45   148.44     ....     ....
S&P 600 SmlCp (IJR)     BUY 11/03/14  248   110.24   116.37    +6.13    +5.6%
Total Market  (VTI) Neutral 07/06/15    3   107.30   106.27     ....     ....
Consumer Disc (XLY)     BUY 11/05/14  246    66.83    76.53    +9.70   +14.5%
Cons Disc EWt (RCD)     BUY 11/03/14  248    82.17    90.14    +7.97    +9.7%
Consumer Stpl (XLP) Neutral 06/04/15   35    47.98    48.61     ....     ....
Cons Stpl EWt (RHS) Neutral 06/29/15   10   105.85   107.37     ....     ....
Energy        (XLE)    SELL 06/01/15   38    77.67    73.11    +4.56    +5.9%
Energy EWt    (RYE)    SELL 06/04/15   35    66.39    62.36    +4.03    +6.1%
Financial     (XLF)     BUY 02/13/15  146    24.23    24.35    +0.12    +0.5%
Financial EWt (RYF) Neutral 07/08/15    1    43.93    44.19     ....     ....
Health Care   (XLV)     BUY 10/23/14  259    63.67    74.28   +10.61   +16.7%
Health Cr EWt (RYH)     BUY 05/09/14  426   115.60   158.77   +43.17   +37.3%
Industrial    (XLI) Neutral 06/05/15   34    55.58    53.63     ....     ....
Industrl EWt  (RGI) Neutral 06/08/15   31    88.47    85.73     ....     ....
Materials     (XLB) Neutral 06/25/15   14    49.58    47.03     ....     ....
Materials EWt (RTM) Neutral 06/29/15   10    85.85    83.42     ....     ....
Technology    (XLK) Neutral 06/30/15    9    41.40    40.79     ....     ....
Technolgy EWt (RYT) Neutral 06/30/15    9    90.24    88.58     ....     ....
Utilities     (XLU) Neutral 02/20/15  139    44.92    42.74     ....     ....
Utilities EWt (RYU) Neutral 02/25/15  134    75.11    70.68     ....     ....

Average                                78                              +12.0%
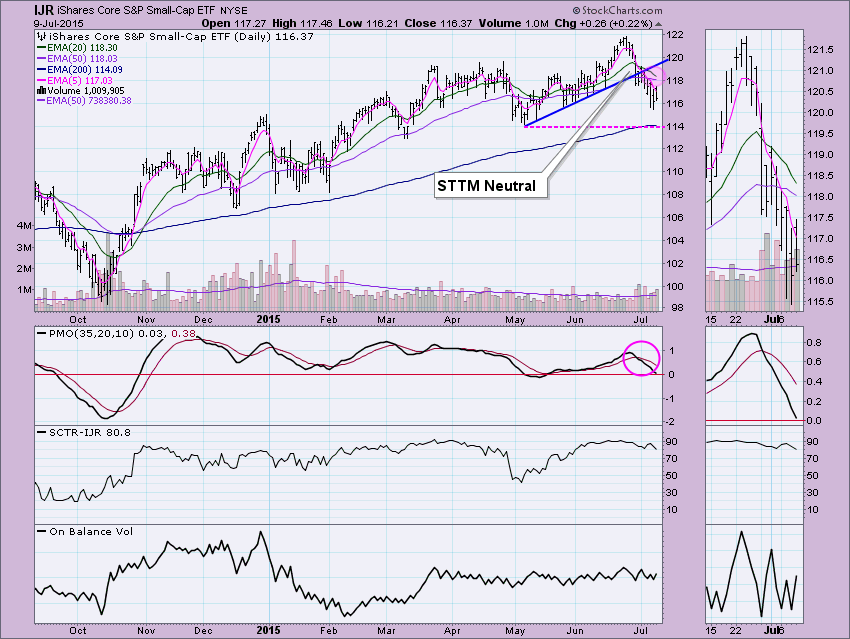
The first BUY signal on the table is IJR, the S&P 600 ETF. It went on a Short-Term Trend Model (STTM) Neutral signal back in June. The current ITTM BUY signal has been in place since 11/3/14, but it appears it will fail very soon. Price broke down below rising bottoms support and has been trending lower ever since. Price seems destined to test support at the May low.
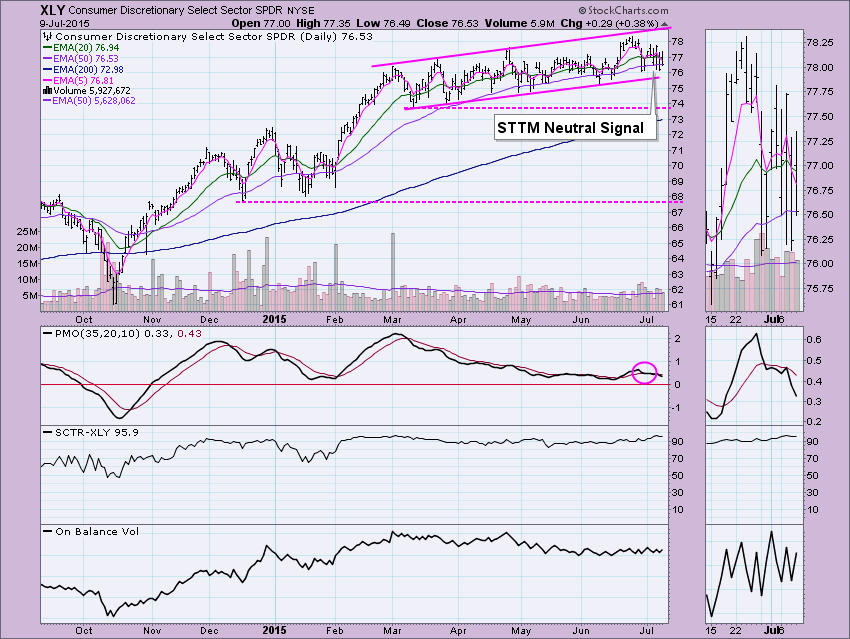
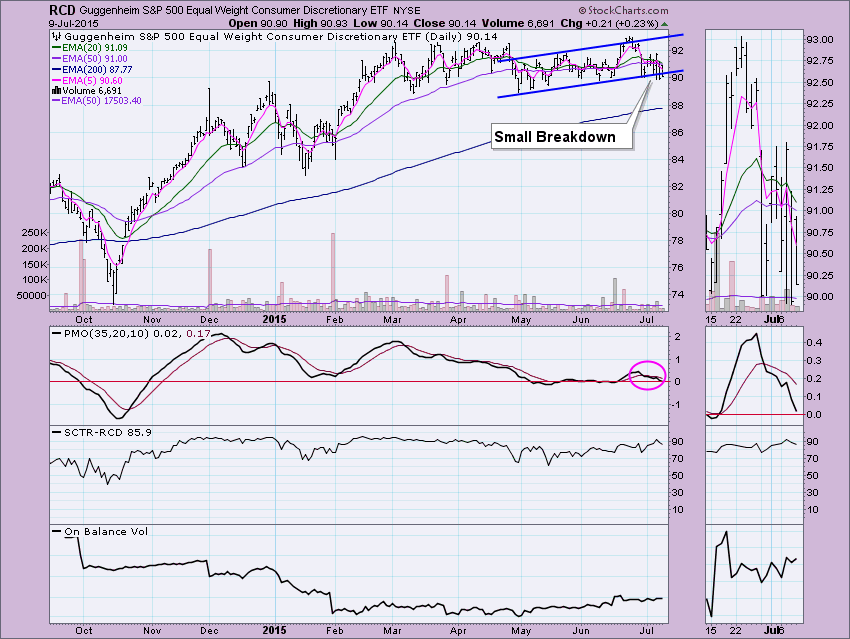
The next pair are the Consumer Discretionary ETF (XLY) and the equal-weight version (RYF) which have been on BUY signals for 246 and 248 days respectively. There will almost always be a similar chart pattern between the cap-weighted and equal-weight versions, and we see that here. Again, STTM Neutral signals have recently triggered on both and while the 20-EMA isn't that close to negative crossover the 50-EMA on XLF, the equal-weight version RYF has broken down below rising bottoms support and is very close to the 20/50-EMA crossover. These BUY signals will be switching to Neutrals soon.
 .
.
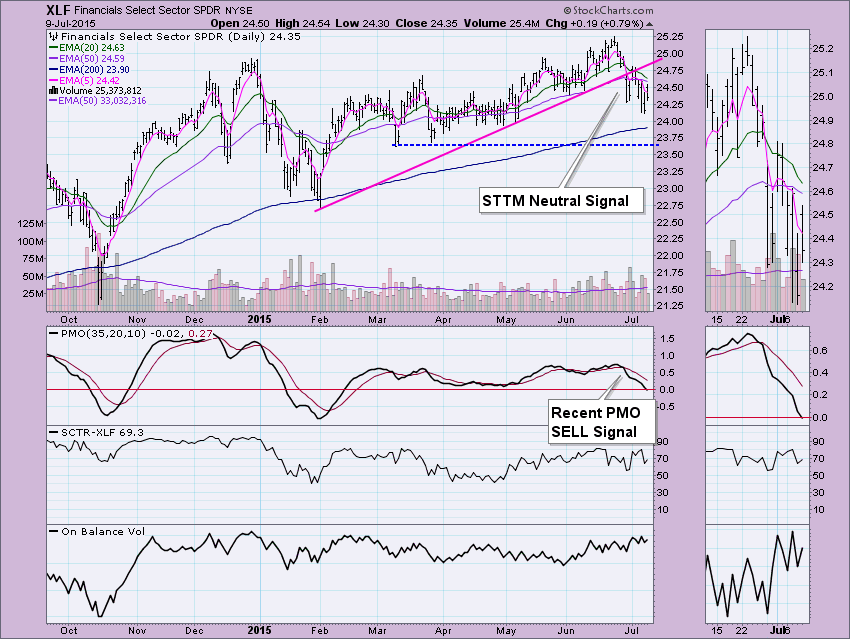
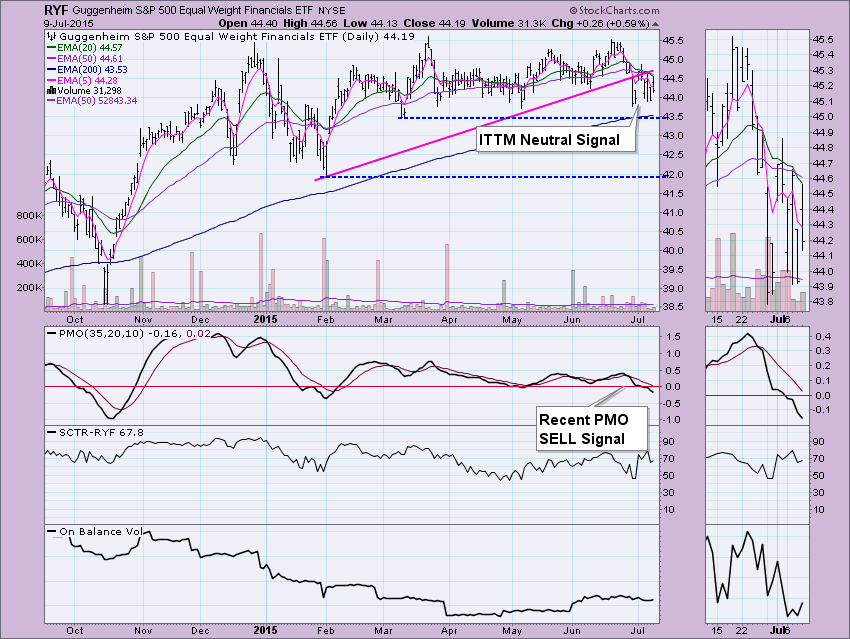
In the Financials sector, we the SPDR (XLF) on a BUY signal generated 146 days ago. However, the equal-weight version has already succumbed to an ITTM Neutral signal yesterday. XLF had a STTM Neutral signal occur at the end of June, the PMO reading is now negative and a 20/50-EMA crossover is inevitable right now. Knowing that the equal-weight RYF had already switched to an ITTM Neutral signal, a look at XLF's chart was not really necessary; we know that the signal has already failed on RYF which implies that XLF will flip too.
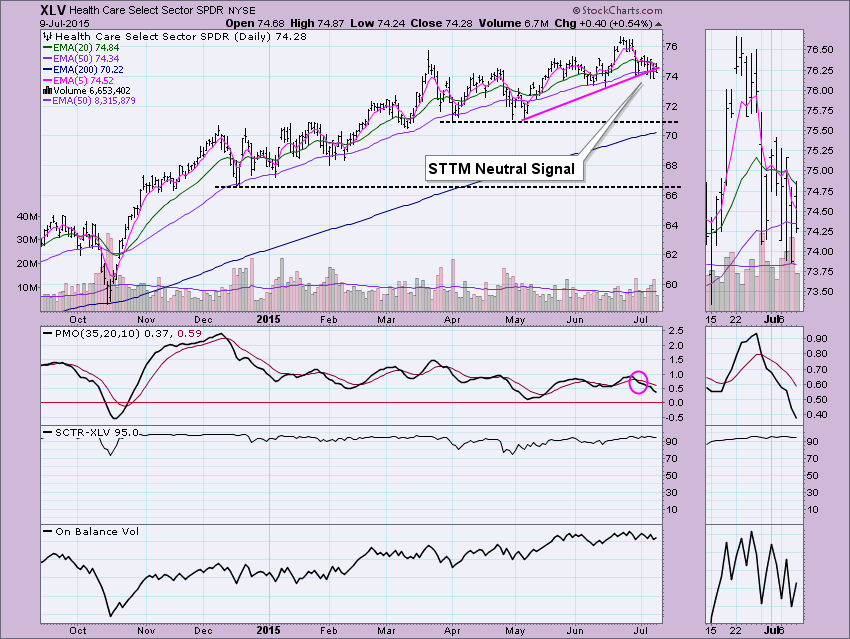
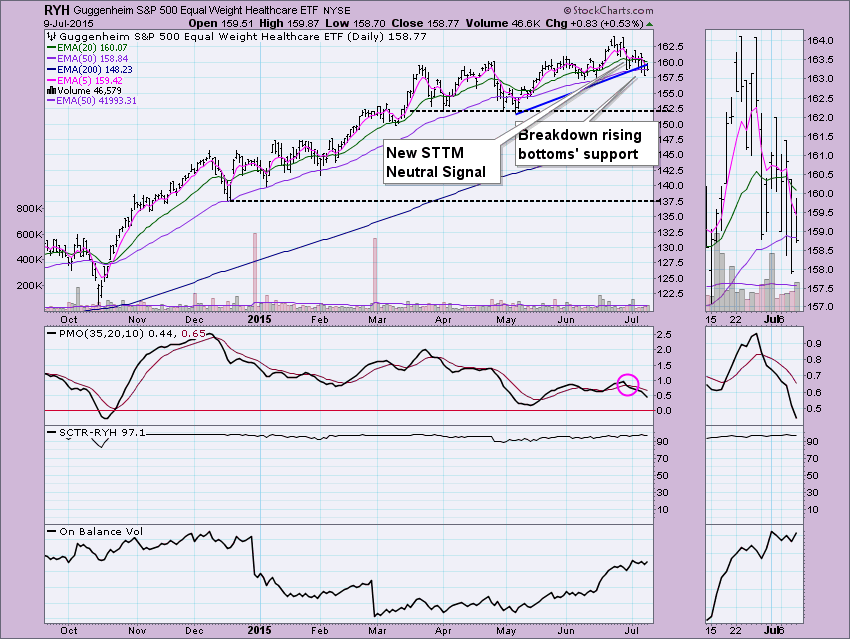
The final sector on a BUY Signal is the Healthcare sector. The SPDR (XLV) had a very recent STTM Neutral signal. Price had a small breakdown below rising bottoms support but is attempting to recapture it. It doesn't seem likely as momentum is not on its side as the PMO is falling and accelerating lower. The equal-weight version (RYH) has a similar chart. There is the opportunity for both to avoid the ITTM Neutral signal as there is some distance between the 20/50-EMAs, but price needs to get back above the rising bottoms line and the 50-EMA at the very least.
Summary: While we still are showing several sectors on ITTM BUY signals, they are almost all tenuous. Healthcare has the best opportunity to hold on to its 259 and 426 day BUY signals respectively, but the market as a whole is weak and bearish so the likelihood seems low.
Technical Analysis is a windsock, not a crystal ball.
Happy Charting!
- Erin


