 I recently received an email from one our DecisionPoint veterans who followed us in our early years. He asked about the Thrust/Trend Model (T/TM) which we used to employ instead of the Trend Model to determine our timing signals. Before we moved to StockCharts.com, Carl opted out of using the T/TM in favor of the simpler Trend Model. However, if you want to add an extra dimension to straight trend analysis, you'll want to learn about "Thrust".
While considered a fencing term, "thrust" is an excellent allusion to the same-named component in the Thrust/Trend Model. What Carl found was that while using Trend Model 5/20/50/200-EMA crossovers, you sometimes stayed out of the market too long while waiting for a bullish 20/50-EMA positive crossover OR the Trend Model generates a BUY signal before Thrust is on a BUY so you end up on a possible "losing" BUY signal. That's where "Thrust" comes in.
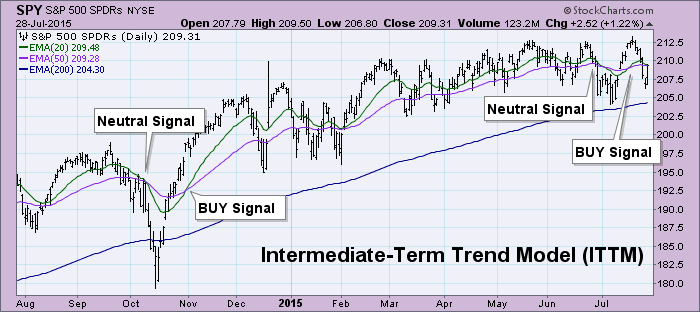
First, let's look at how the Trend Model generates intermediate-term signals.
When the 20-EMA crosses above the 50-EMA that generates a BUY signal on the Trend Model. A 20/50-EMA negative crossover is different. If the 20-EMA crosses below the 50-EMA while the 50-EMA is above the 200-EMA, that is "neutral"; if it is below the 200-EMA, that is a "sell" signal. When the 50-EMA is above the 200-EMA it is considered to be in a "bull market", so consequently you don't want to enter a SELL or short position when the long-term trend is bullish. Currently, we are on an Intermediate-Term Trend Model BUY signal on the SPY.
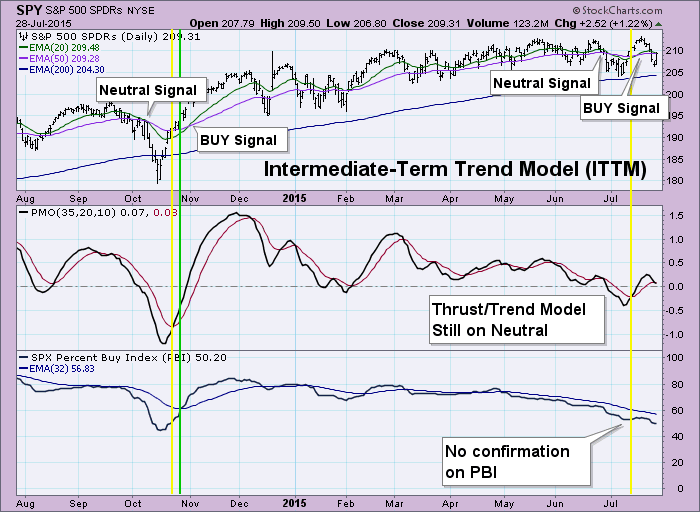
The Thrust/Trend Model reacts differently. Let's look at the same time frame, but add the Thrust component. The Thrust component is made up of two indicators, the PMO (Price Momentum Oscillator) and the Price Momentum Model (PMM) PBI (Percent Buy Index). In order for the T/TM to generate a BUY signal, BOTH the PMO and PBI must be above their signal lines. Once a BUY signal generates on the Thrust component (which is a BUY signal for the T/TM), confirmation is needed from the Trend component of a 20/50-EMA positive crossover to maintain the signal. If the Trend component never confirms with a positive 20/50-EMA and either the PMO or PBI cross back below their signal lines, the BUY signal reverts to the last Neutral or SELL signal. If the Trend component confirms the Thrust component BUY, then the Thrust component is no longer needed and we only watch the Trend component for failure of the BUY signal. Once the T/TM is on a Neutral or BUY signal, we start over again, waiting for the Thrust component to go on BUY when the PMO/PBI both move above their signal lines.
The chart for the SPY below is the same time frame as the one above only I've added the Thrust component of the PBI and PMO to the chart. Notice that the first Thrust component BUY signal arrives sooner than the Trend Model BUY signal. More importantly is the current position of the T/TM. Note that in late June, the 20-EMA crossed below the 50-EMA, canceling the T/TM BUY signal that was confirmed in late October. In order to generate a new T/TM BUY signal, the PMO and PBI both need to move above their signal lines. That has NOT happened, only the PMO made it above its signal line and we need the PBI to also move to a BUY to change to a BUY signal, meaning that the T/TM is still on a Neutral signal. Remember that once a T/TM Neutral or SELL occurs, the Trend component is no longer relevant; so while the 20-EMA did cross above the 50-EMA a few days ago, it doesn't matter to the T/TM, the PMO/PBI are in charge of generating BUY signals. The SPY must wait for the Thrust component to move to a BUY in order for the T/TM to move to a BUY. Yes, by staying on the T/TM Neutral signal, we would have lost out on the recent rally, but we also would have missed the correction that followed by being on a Neutral signal.
The main idea is that Thrust is in charge of determining BUY signals. They "stick" if the Trend component moves to a BUY (20/50-EMA positive crossover). If the Trend does NOT confirm the Thrust BUY signal, it is vulnerable to failure should the PMO or PBI move back below their signal lines. If the Trend component DOES confirm the BUY signal, the Thrust component is thrown out the window until after the Trend component generates a Neutral/SELL signal with a negative 20/50-EMA crossover. I'll be going over this in detail in tomorrow's webinar, so join me and learn how to refine your trend analysis. You can sign up for DP LIVE! Webinars from the Homepage under the "What's New" section near the bottom. There currently is not an article on the Thrust/Trend Model in ChartSchool, but it will be arriving soon!
Technical Analysis is a windsock, not a crystal ball.
Happy Charting!
- Erin


