 If you check out the DP Chart Gallery Scoreboards, you'll see that the picture for the Dow Industrials is bearish while the other indexes (SPX, NDX and OEX) are looking much more bullish. The question becomes, are the Dow Industrials lagging or will they lead the market lower? If you've read my recent DecisionPoint Alert articles, you'll know that while the intermediate term is somewhat bullish for the market, the short term is beginning to suggest a buying exhaustion is around the corner. Here's a chart of all of the DecisionPoint Scoreboards. You can see that the Dow is in a completely different place than the other three major indexes. The NDX appears to be the strongest having been on BUY signals despite the correction earlier this month. Let's check out the charts!
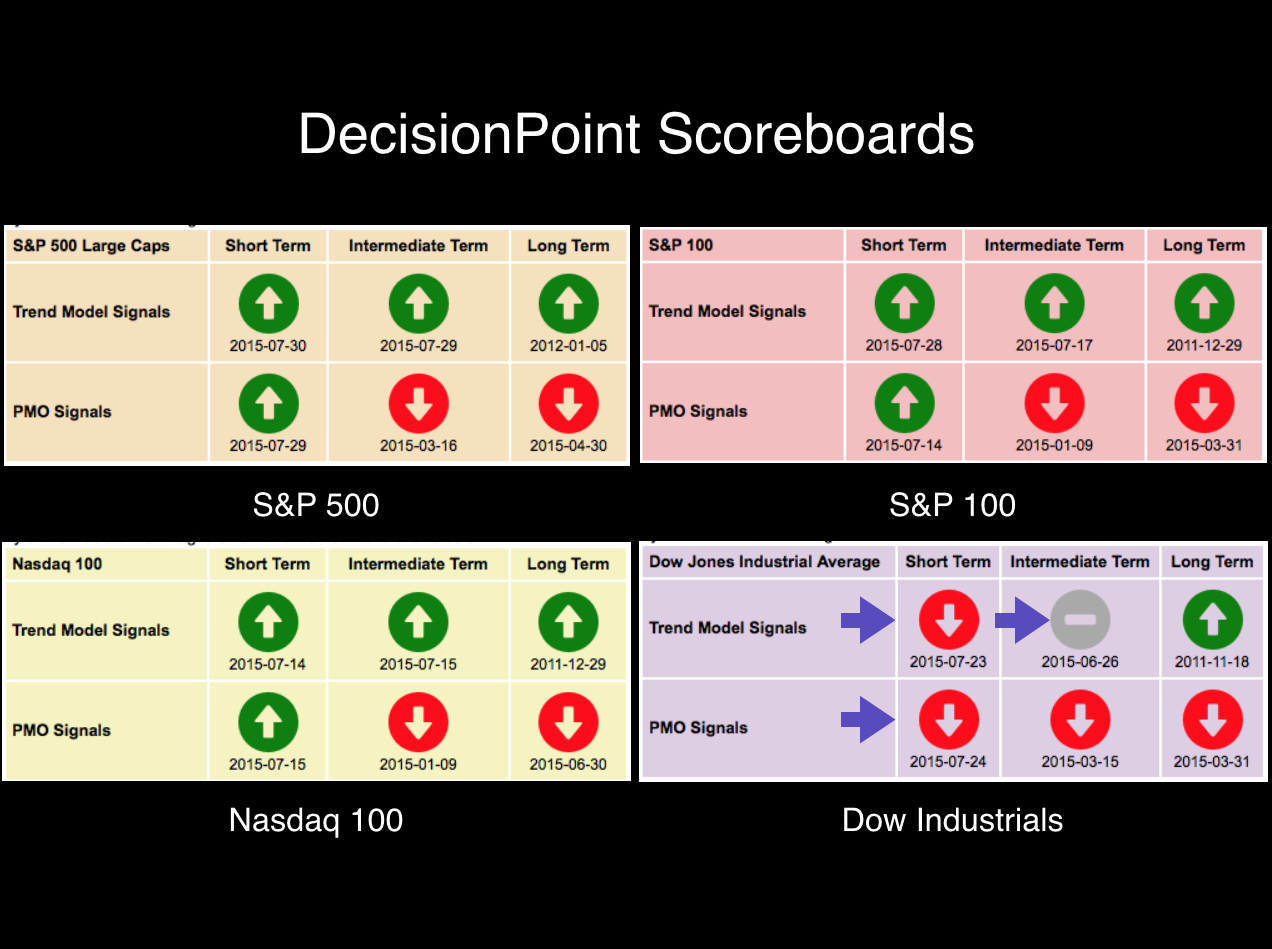
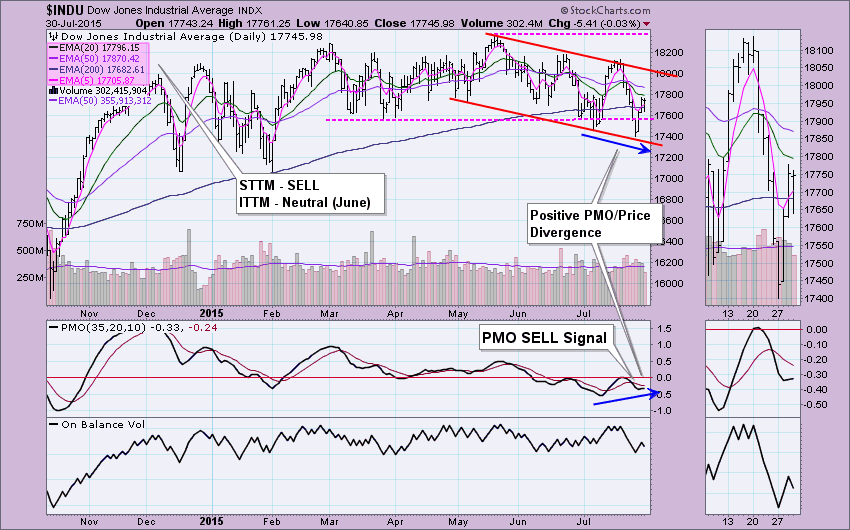
All four indexes shows that the Dow Industrials have indeed been struggling for quite some time while the other indexes have been in rising trend channels or even horizontal trading channels; whereas the Dow has been in a declining trend channel. The bad news is all over this chart: declining trend channel, EMAs with separation that could prevent BUY signals from occurring in the near future, current Neutral and SELL signals on the Short-Term Trend Model (STTM) and Intermediate-Term Trend Model (ITTM), and the Price Momentum Oscillator (PMO) is on a SELL signal. There is a bright spot on the $INDU chart, a possible PMO positive divergence with price and a PMO bottom that could lead to a crossover BUY signal.
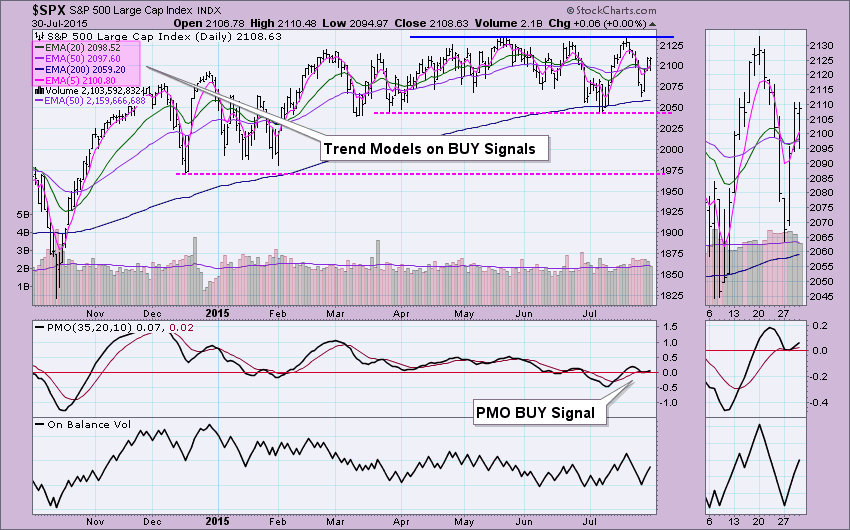
The SPX looks more healthy. Trend Models are on BUY signals and price is traveling within a horizontal trading channel rather than a declining trend channel like the Dow. The PMO is on a crossover BUY signal. However, the problem with this chart is the tightly bunched EMAs. They are vulnerable to whipsaw signal changes. Price is intertwining above and below the cluster which is causing the various STTM and ITTM switches from bullish to bearish. Based on my analysis in the DecisionPoint Alert today, I see price hitting a buying exhaustion soon.
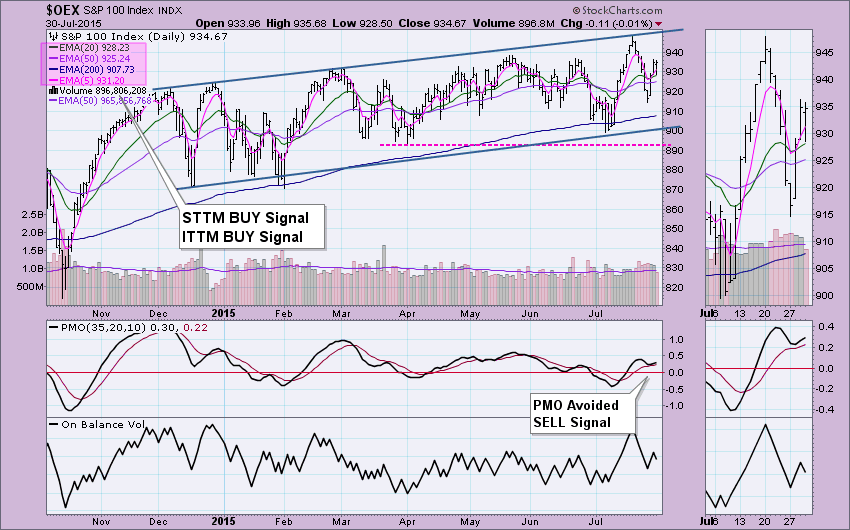
The OEX is more favorable than both the INDU and SPX. These large cap stocks have been traveling somewhat sideways, but definitely within a medium-term rising trend channel. The Trend Models are on BUY signals and the PMO was able to sustain a BUY signal. The Trend Model BUY signals look fairly intact with some space between the EMAs. It looks like price will make a run for the top of the channel. That isn't too far away and once hit, it will likely move back down to the bottom of the channel.
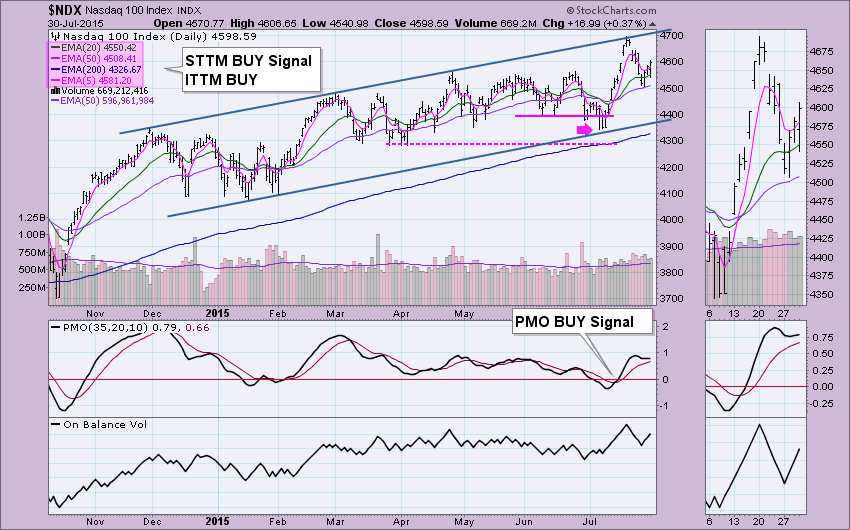
The NDX is the strongest of the four with a more steeply rising trend channel that the OEX and EMAs with plenty of distance between them to prop up the Trend Model BUY signals for a bit longer. The PMO is on a BUY signal and bottomed cleanly above its signal line which is very bullish.
Conclusion: I believe the tortoise and the hare is a very good allusion to this story of the Dow Industrials. It has been and is now a tortoise, lagging behind the stronger indexes. However, the other indexes are vulnerable for pullbacks as they get closer to their all-time highs. The story goes that the hare being overconfident in beating the tortoise in the race, decides to take a nap. In the meantime, the tortoise passes him and wins the race. The Dow is lagging, but when the other indexes reach their highs, they will probably begin the decline that the Dow has already been struggling with and at that point, you could infer that the tortoise (Dow) will lead the hare (the market) lower.
Technical Analysis is a windsock, not a crystal ball.
Happy Charting!
- Erin

