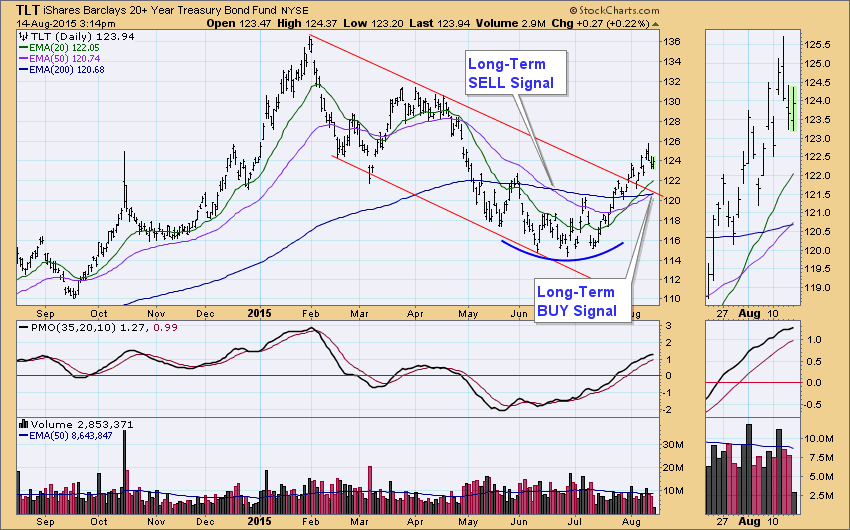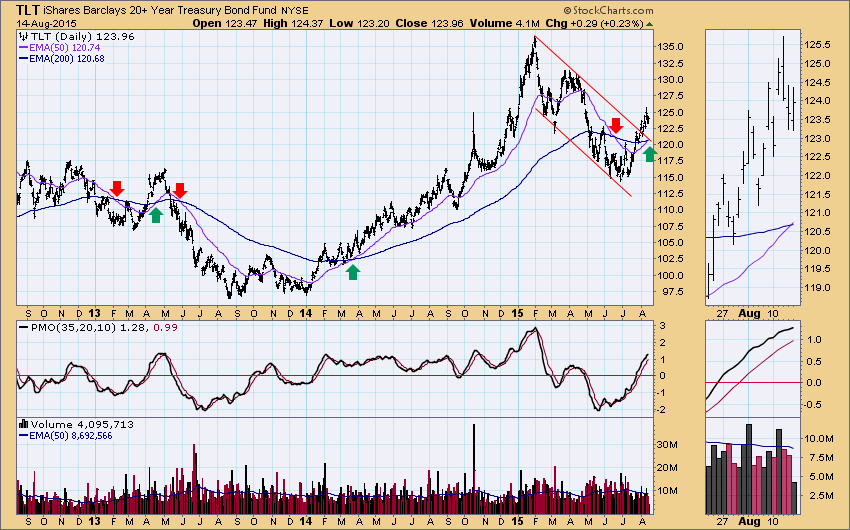
At the end of June I published an article showing where bonds (TLT) had generated a Trend Model long-term SELL signal when the 50EMA crossed down through the 200EMA; however, as of Friday's close the 50EMA crossed back up through the 200EMA, generating a long-term BUY signal. Two months from long-term SELL to BUY? What's up with that?
The generally accepted definitions of various time frames are as follows:
Short-Term: Days to weeks.
Medium (Intermediate)-Term: Weeks to months.
Long-Term: Months to years.
These are just a guide as to the kinds of durations we should expect, but, of course, there are no guarantees, and we should temper expectations in the face of actual price movement. As for TLT, a price low was hit mere days after the SELL signal was generated, and before too long price formed a bullish saucer bottom. Once price moved above all the EMAs, it was a pretty good sign that the SELL signal was to be short-lived.
Whipsaw action has been pretty common in the last three years, with six long-term signal changes during that time. For the current signal duration the nominal expectation is months to years; however, there is limited upside price potential because interest rates are extremely low, which presents overhead resistance for bonds. If there is another pullback which takes price below the EMAs again, they will turn down, and another downside crossover is possible.
CONCLUSION: The new long-term BUY signal for TLT tells us to expect bullish resolutions more often than not; however, low interest rates limit the upside potential for bonds, and choppy sideways movement is the best I would expect. Such an environment makes it likely that more whipsaw signals are ahead.
Subscribe to Carl's free blog and receive email whenever a new article is posted. See subscription links at the upper right corner of this page.
Technical analysis is a windsock, not a crystal ball.


