 I'm sorry I simply couldn't resist the pun. Tom and Greg always seem to be having all the fun with their "punny" headlines so it's my turn. Apple could be entering correction mode. The question is whether it is only a short-term proposition. Word is that sales are a problem in China. Apple's vendors are declining, suggesting that possible depressed sales of Apple products are the issue. The other concern that analysts are expressing is worry over whether Apple can maintain their market share. Let's face it, this has been a constant concern for Apple, yet they have always managed to stay not only relevant, but dominant. Unfortunately, with an overall market environment that is bearish, it will be difficult for Apple to turn it back around. The charts tell the story.
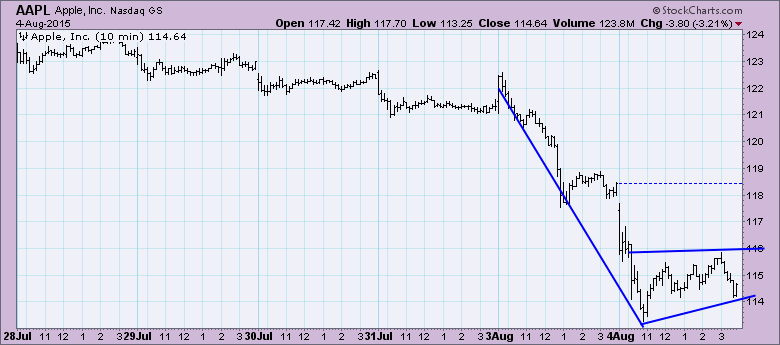
Every one of the following charts on Apple have negative implications. Starting in the ultra-short-term looking at the 10-minute bar chart, I immediately picked out a reverse flag. This is a bearish pattern that could imply another price decline to roughly 104 based on the size of the flagpole. A word of caution, patterns can be identified on 10-minute bar charts, but many times they don't execute.
A peek at the daily chart and we see that a price decline to 104 is more than possible, it seems likely. Support at the January lows is around 104. Right before the 7/27 Price Momentum Oscillator (PMO) SELL signal, the Intermediate-Term Trend Model generated a Neutral signal on 7/23 and the Short-Term Trend Model generated a SELL signal on 7/24. Check out the destruction of the SCTR value. OBV implies volume was high on the down days.
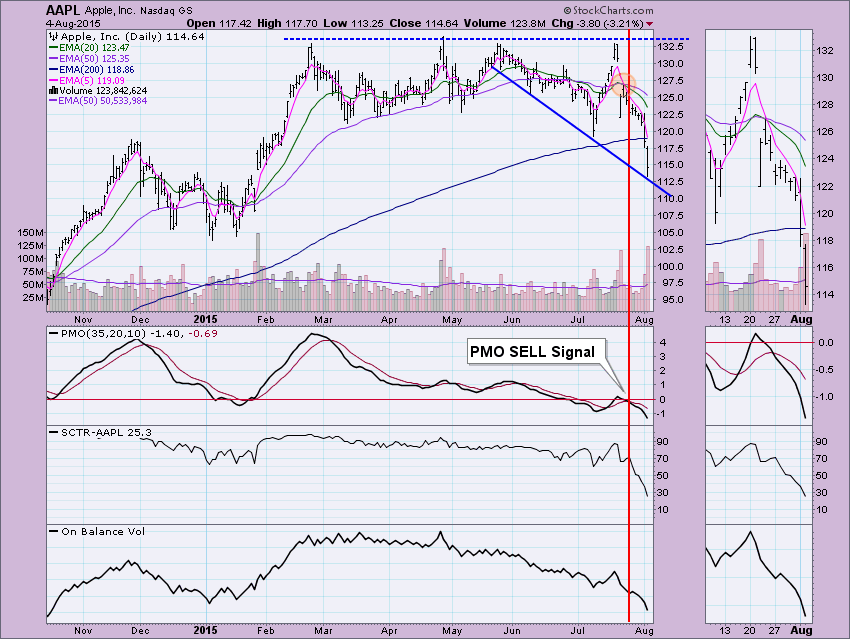
Notice also that this is the first time Apple closed below its 200-EMA since the beginning of 2014.
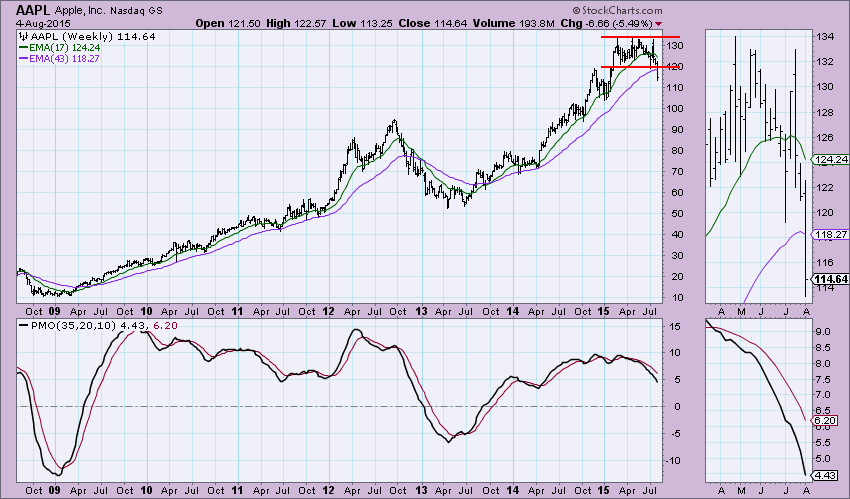
The weekly chart looks especially bearish. This chart technically doesn't go "final" until after the Friday close, but the breakdown has already occurred. The Intermediate-Term (weekly) PMO had a SELL signal during the consolidation phase. It is dropping steadily but hasn't reached oversold territory yet.
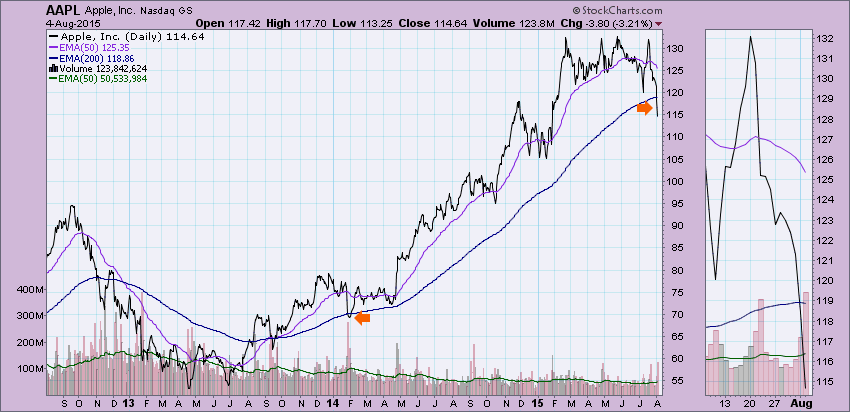
The monthly chart has more negative implications. In 2013 price broke below the rising bottoms trend line. Since then it has stayed up against it like a form of resistance. The thumbnail shows that price broke below the 10-month-EMA for the first time since early 2014. This chart won't go "final" until August 31st, but currently there is a brand new Long-Term (monthly) PMO SELL signal.
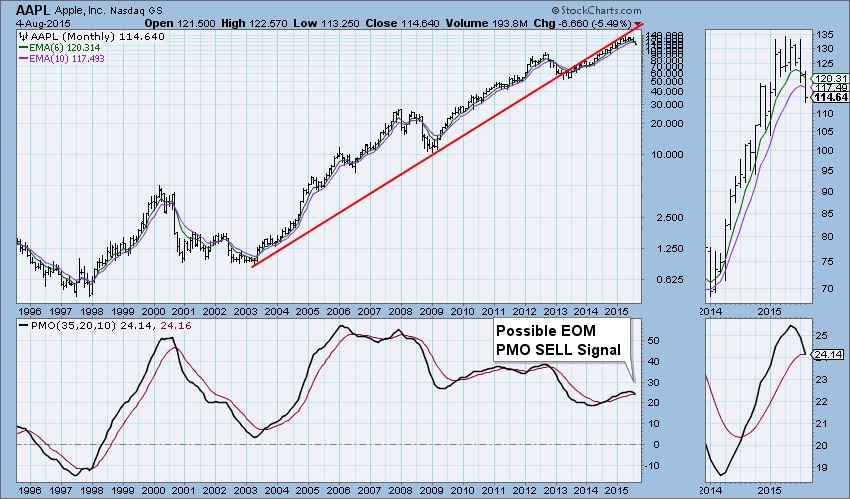
Everyone is talking about Apple's shorter-term problems, but looking at the technicals in the weekly and monthly charts, the issues are much farther reaching.
Technical Analysis is a windsock, not a crystal ball.
Happy Charting!
- Erin


