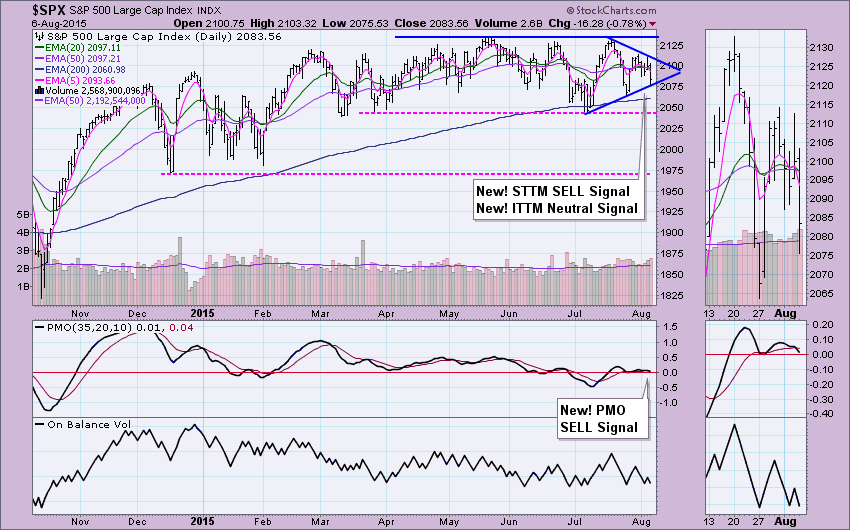
 This week the $SPX has been flip-flopping more than a sleazy politician. The Short-Term Trend Model (STTM) went from a BUY on Monday to Neutral on Tuesday to a BUY on Wednesday and today to a SELL signal. Ugh. There was a difference today. The STTM SELL signal on the $SPX was also accompanied by a Short-Term Price Momentum Oscillator (PMO) SELL signal and an Intermediate-Term Trend Model (ITTM) Neutral signal. Let's look at the current Scoreboards.
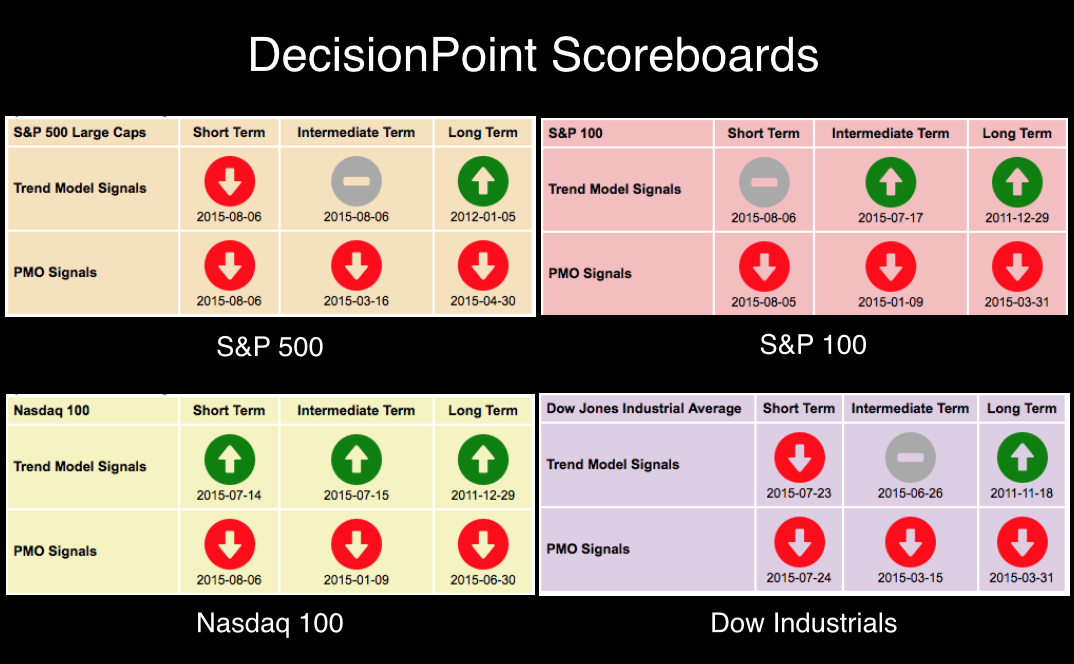
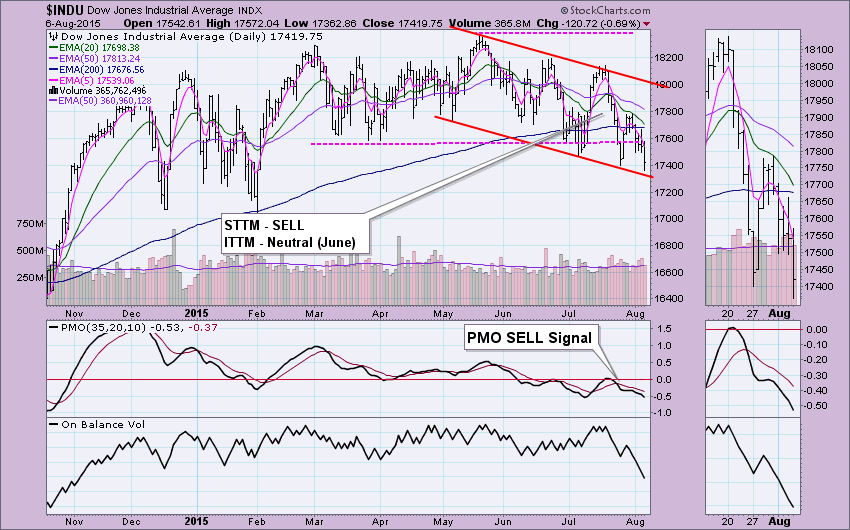
The new signals occurred on not just the $SPX, but also on the $NDX and $OEX. The Dow hasn't changed. It has managed to avoid all the flip-flopping mainly because it has been in a bearish position for a few weeks now, the rest are now just catching up, or should I say catching down. The NDX is still the strongest of all the indexes, but with the tech sector beginning to stall, it should catch some Trend Model Neutral signals soon. Let's start with the strongest chart and move to the weakest.
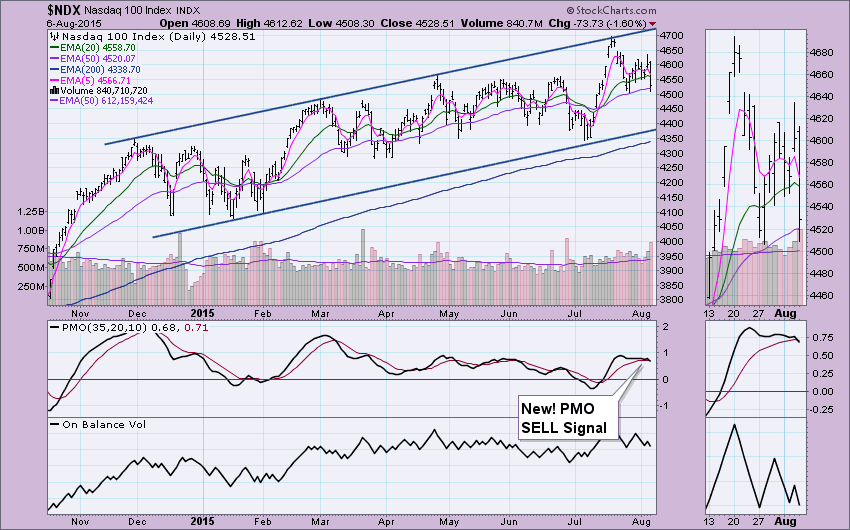
The NDX is definitely holding the strongest chart. It has a nicely rising trend channel and its EMAs have good separation. However, the 5-EMA is racing lower to catch the 20-EMA. A negative 5/20-EMA crossover will generate a STTM Neutral. The PMO generated a new SELL signal as it crossed below its signal line. If it continues lower, as the PMO suggests it will, support could be found along the bottom of the channel around 4400 or to 4350, the July low.
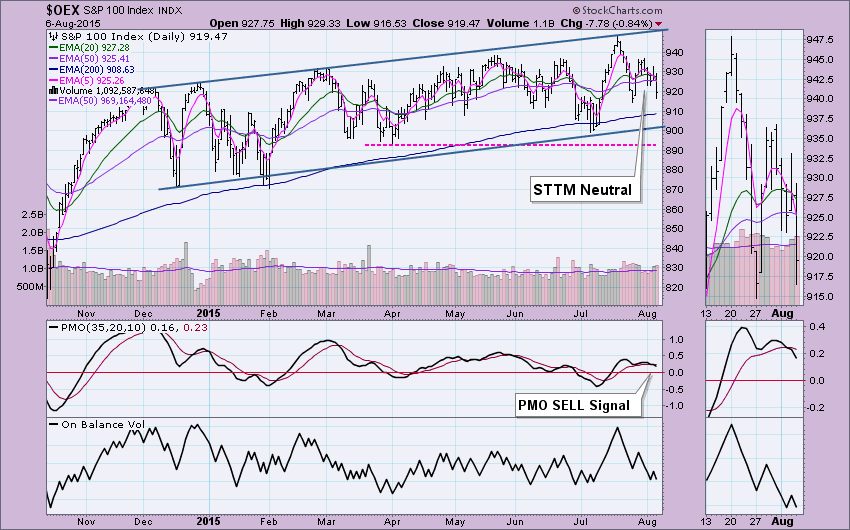
The $OEX has the next best chart. A rising trend channel is visible, but that is the only positive on the chart except for the ITTM BUY signal that is still intact. There was a new STTM Neutral signal generated as the 5-EMA crossed below the 20-EMA while the 20-EMA was above the 50-EMA. The PMO SELL signal is a problem. I would expect to see price move to the bottom of the trend channel near July lows.
The $SPX got hit hard today, but given the thin margin between its EMAs, the Trend Model signals have less impact because, as we've seen this week, they can flip-flop over and over until they put some distance between each other. The STTM generated a SELL signal because the 5-EMA crossed below the 20-EMA while the 20-EMA was below the 50-EMA. The ITTM generated the Neutral signal when the 20-EMA crossed below the 50-EMA. It was a Neutral and not a SELL because the 50-EMA is still above the 200-EMA. Price is bounded within a symmetrical triangle. This is a pattern that unfortunately doesn't give us an up/down expectation. Once price breaks out of the triangle, the expectation is that price will continue in the direction of the break. Given the negative PMO and new bearish signals, I would bet on a break down. Support is at the July low or the December low if it falls below the July low.
The Dow has been lagging the other indexes and it doesn't appear ready to come out of the declining trend channel. Price reached the bottom of the channel today, already surpassing the March/July lows. The next area of horizontal support lies at the January/February lows.
The question I've been asked frequently these days is how can we use the Trend Model signals when they keep flip-flopping? When the EMAs are thinly spaced like they are on the $SPX in particular, it is difficult to use the Trend Model as a guide. This is why we have the PMO and the other DecisionPoint market indicators. I suggest you scroll through the DP Chart Galleries and review the market indicators therein. I'll be demonstrating and talking about the best DP market barometers you can use to clear away some of the noise in my next webinar. Please join me at 7:00pm EST for DecisionPoint LIVE! After Dark. You'll find the sign up links in the "What's New" section at the bottom of the StockCharts homepage.
Technical Analysis is a windsock, not a crystal ball.
Happy Charting!
- Erin


