Last week I highlighted CVI and Participation Index readings I had never seen before. This week I want to point out some useful relative strength behavior I just noticed for the first time. My focus is on the S&P 500 SPDR (SPY) and the S&P 500 Equal Weight ETF (RSP). I have long been partial to equal weight indexes because in bull markets they typically perform much better than their cap-weighted counterparts. Case in point, note how RSP advanced +343% from the 2009 price low versus only +252% for SPY, meaning that RSP performed +36% better than SPY. The reason for this is that smaller-cap stocks tend to perform better than large-cap stocks in bull markets. But wait, the S&P 500 Index is composed of large-cap stocks. True, but the biggest stocks in the S&P 500 are really, really big--the top 57 stocks (11% of the total) compose 50% of the total weight. So while the remaining 443 stocks are classified as large-cap, they are a lot smaller than the giants at the top.
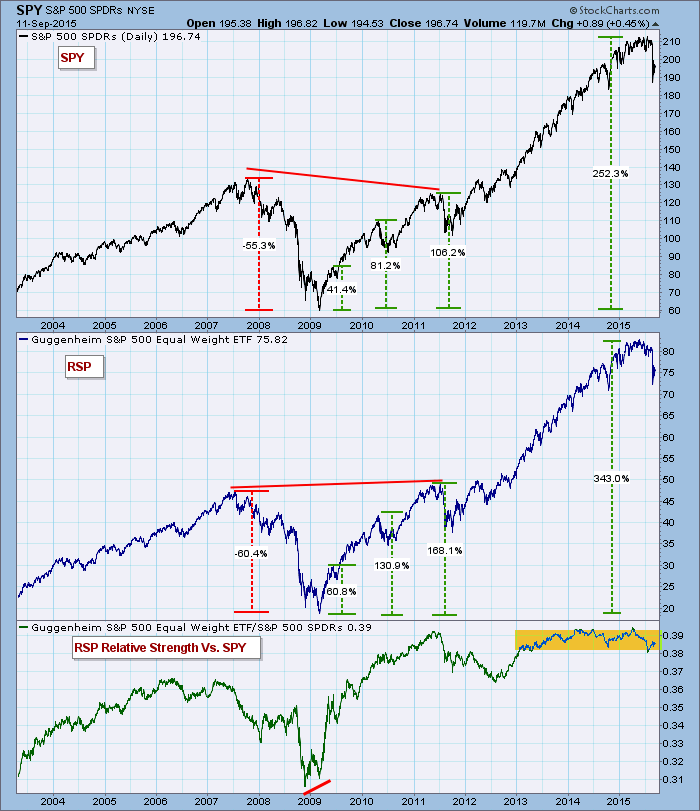
When we divide RSP by SPY we get a relative strength line that tells us when the smaller-cap stocks are stronger (line is rising) or weaker (line is falling) than the large-cap stocks. Note that the equal weight index falls faster during bear markets. Also, note that the relative strength line has been moving sideways for the last few years, and this is where I found some very interesting and useful indicator behavior.
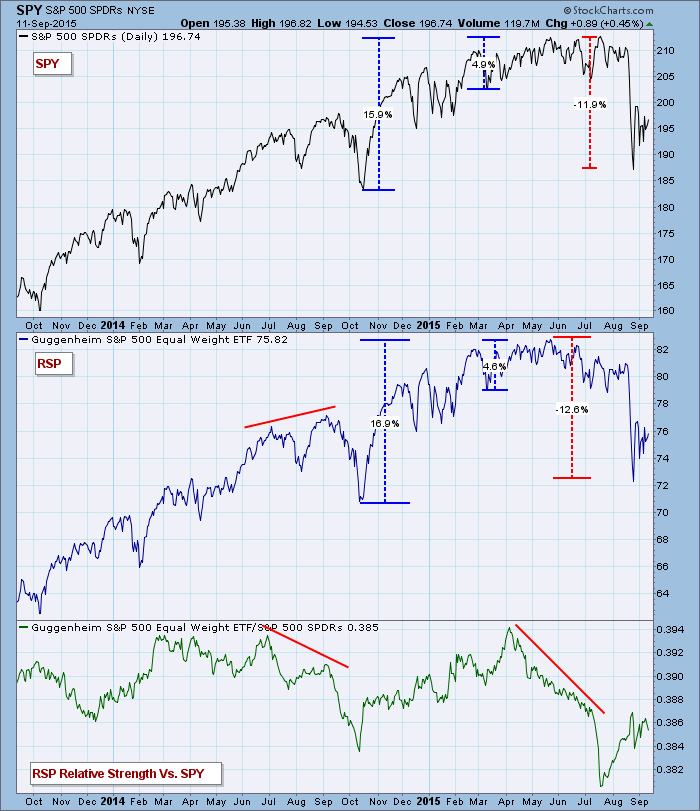
The next chart shows the usual negative divergences--useful, but that's not what we came to see.
More interesting on this next chart are the relative strength "air pockets" that more or less precede sharp price declines. These unusually steep, sudden drops in relative strength identify periods when the smaller-cap stocks in the index have suddenly lost sponsorship. Generally speaking, the broad weakening of smaller-cap stocks in the longer term is a sign that money is favoring larger-cap stocks as the market prepares for a major top, but I have never before noticed this relatively short-term phenomena. I looked back over 12 years of RSP data and these three instances are the only ones I could find. So, is this a useful discovery or not?
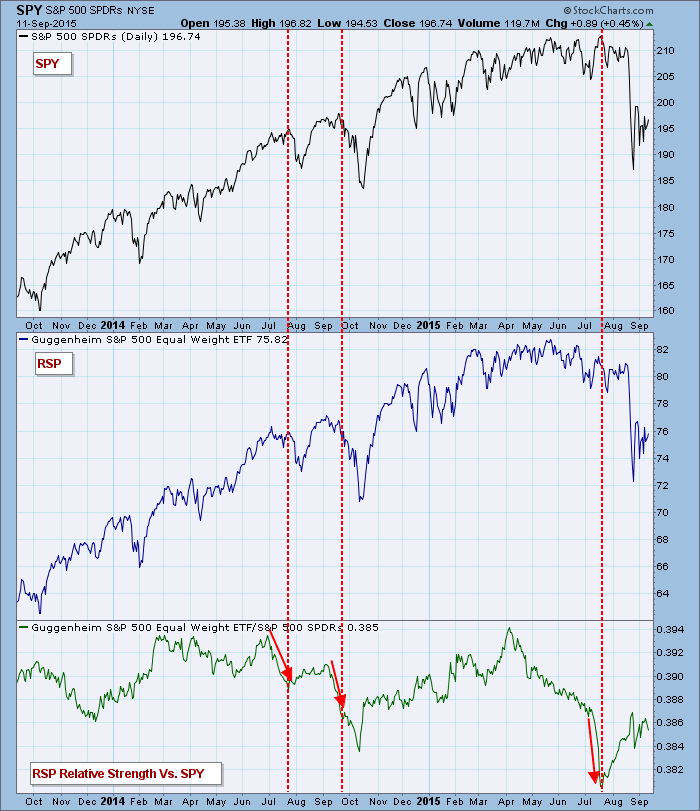
The key is that these air pockets have occurred during a 2.5-year period when the relative strength line was moving sideways in a trading range, as control was switching back and forth between the larger- and smaller-cap stocks. Under these conditions, this appears to be a useful tool for anticipating price tops. The caveat is that the relative strength line must be the result of comparing cap weighted and equal weighted indexes of the same group of stocks.
Technical analysis is a windsock, not a crystal ball.


