 According to the glossary in ChartSchool, the definition of a Bull Trap: A situation that occurs when prices break above a significant level and generate a buy signal, but suddenly reverse course and negate the buy signal, thus “trapping” the bulls that acted on the signal with losses. I'm concerned we may be setting up for one of these traps as our DecisionPoint Scoreboards begin turning green in the short term. In the last week, we have seen the NDX move to Short-Term Trend Model and short-term Price Momentum Oscillator (PMO) BUY signals. Yesterday the Dow Industrials got a corresponding PMO BUY signal and today, both the SPX and OEX generated new PMO BUY signals.
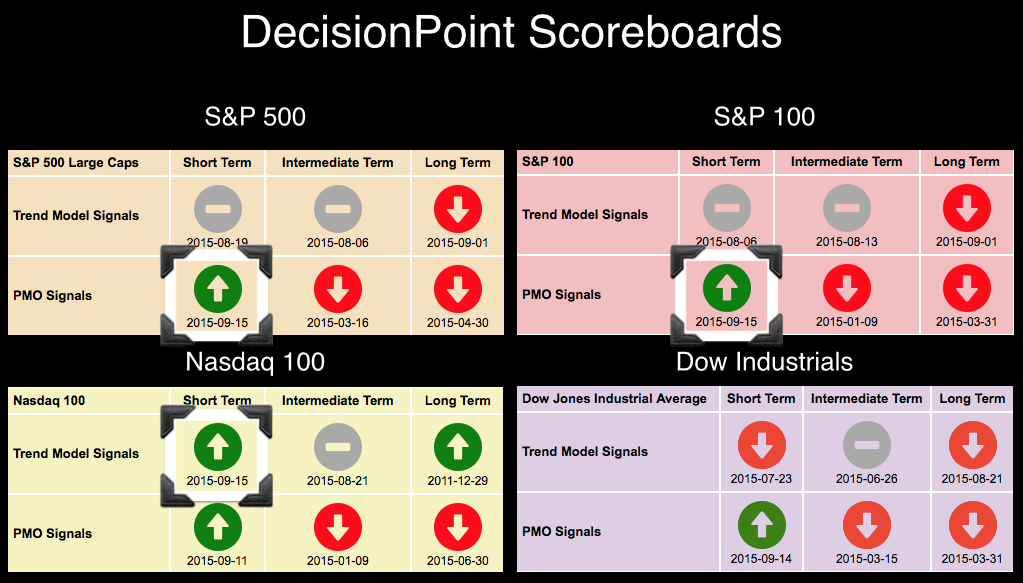
Sounds promising, does it not? Remember that DecisionPoint timing models are mechanical, consequently one must review the chart when these attention flags, in the form of BUY/Neutral/SELL signals, appear.
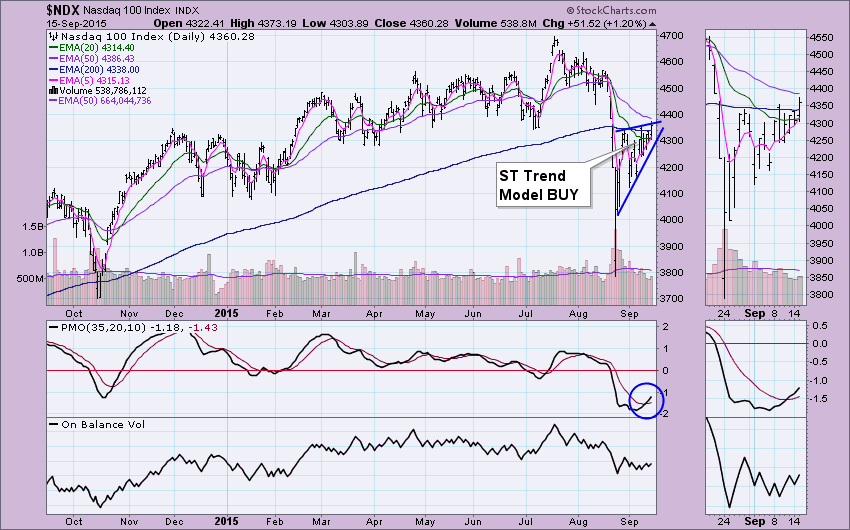
The NDX is the most promising Scoreboard of all, with three bullish green arrows and a new Short-Term Trend Model BUY signal. However, I see a well-formed ascending wedge. These are bearish formations and signal a future breakdown from the wedge. I do like that price managed to rise above the 200-EMA. The OBV has been trending sideways, telling us that volume is not behind the up moves any more than it is for the down moves.
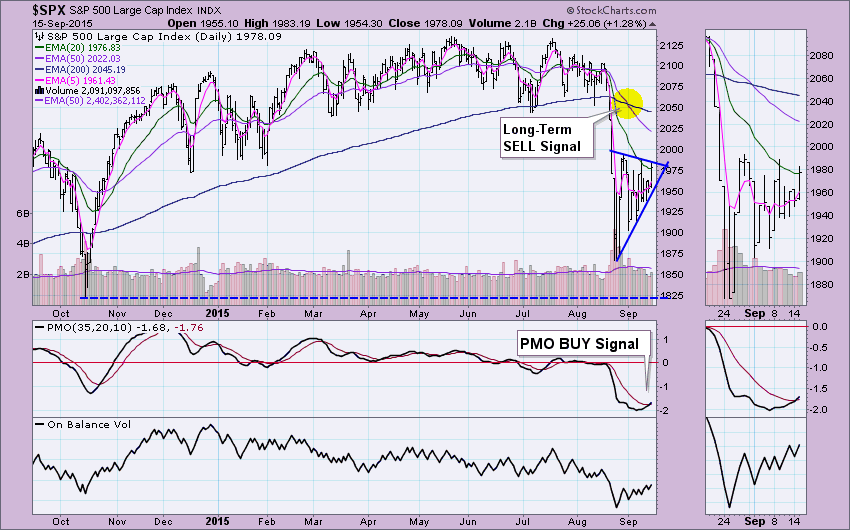
I've highlighted the Long-Term Trend Model SELL signal because this sets the foundation that the SPX is in a bear market. Price is staying within a somewhat symmetrical triangle. You could possibly adjust it to a bullish ascending triangle by flattening the top to horizontal. The PMO BUY signal appeared in oversold territory and the 5-EMA is moving up. OBV is on the side of the bulls as it is rising. Bullish pinnings but in a bearish context.
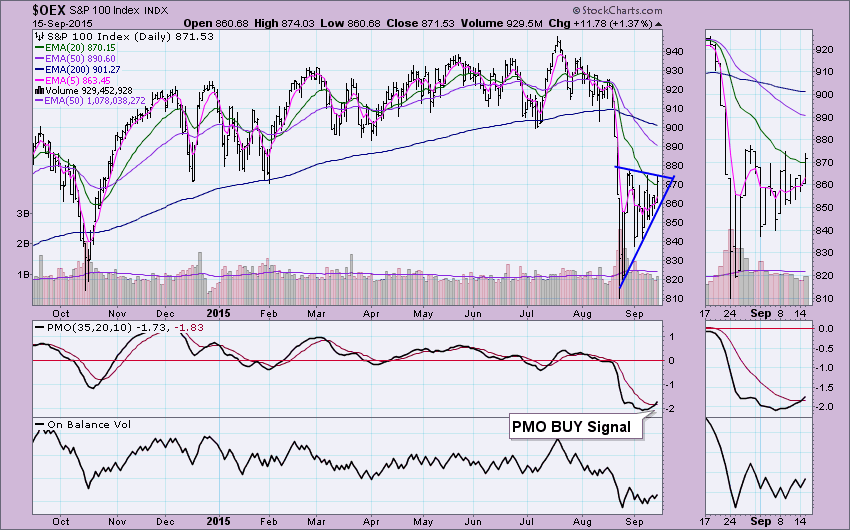
The OEX has a similar appearance, though OBV shows that volume isn't behind rising prices.
The Dow has a similar set up to the SPX and OEX, however it is the only chart with a clear bullish ascending triangle. It suggests that resistance along the horizontal will be broken. This is very possible given the PMO BUY signal. However, even a significant rally would still fit within the bearish trend.
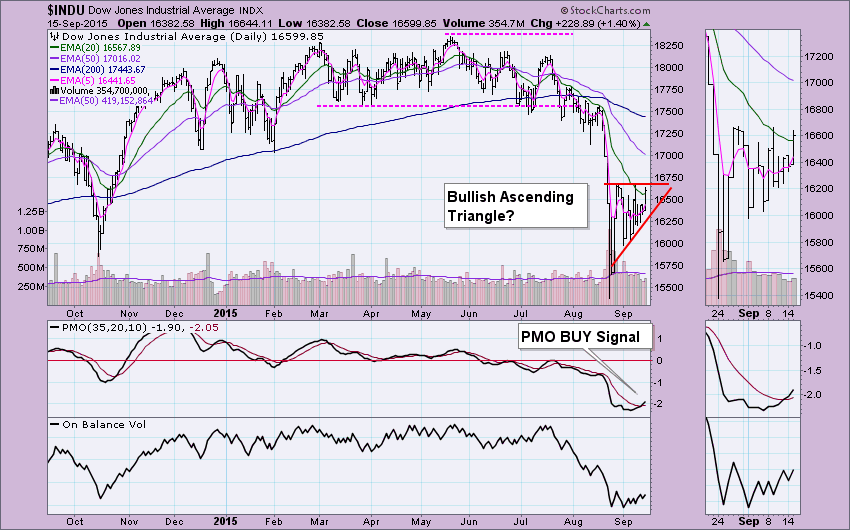
Conclusion: So the question remains whether this is the end of a correction or a short-term rally within a bear market. The intermediate-term and long-term indicators are bearish. Three out of four indexes are officially in bear markets (50-EMA < 200-EMA). While there could be some short-term opportunity right now, I'd use caution as this could be a set-up for a bull trap.
Technical Analysis is a windsock, not a crystal ball.
Happy Charting!
- Erin


