The Rydex Asset Ratio is a solid sentiment indicator because it is based upon an analysis of where people are actually putting their money, not just how they are feeling about the market. It is calculated by dividing *Rydex Bear Fund plus Money Market Assets by *Rydex Bull Fund Assets.
I recently noticed that the Rydex Asset Ratio has become quite oversold, which is the result of increasing asset levels in Money Market and Bear Funds, and decreasing assets in Bull Funds. In a bull market this condition could be a setup for a new rally, but, in my opinion, we are now in a bear market, and bullish outcomes are less likely than bearish ones.
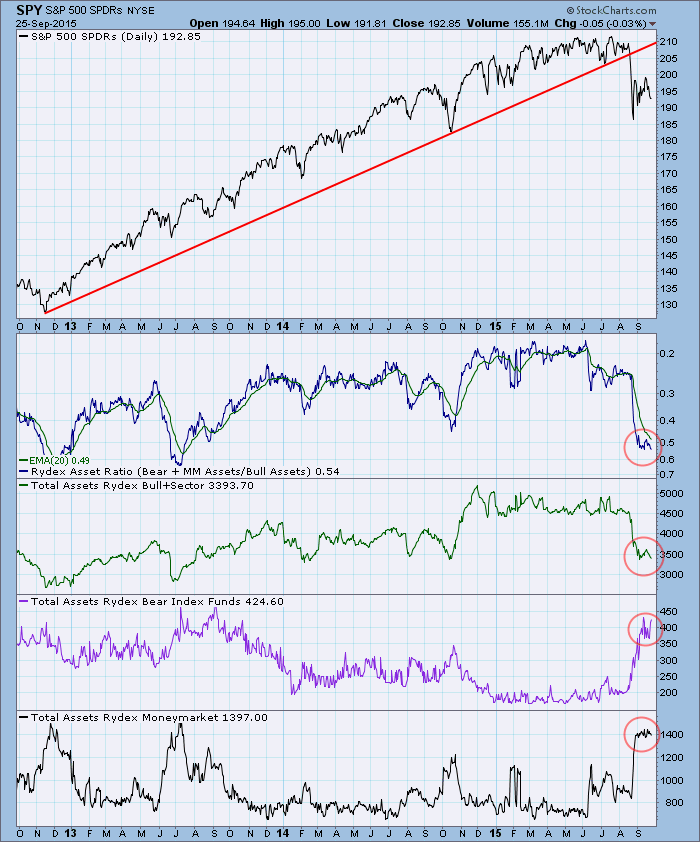
Let's keep in mind that the three-year chart above shows mostly bull market activity, and we need to look at a longer term chart that includes some bear markets so that we will have a better idea of historical ranges. The 17-year chart below shows two complete bull markets and two complete bear markets, and it also shows that current indicator levels are very, very far from normal bear market extremes. The Ratio itself recently reached levels not seen since the major market top in 2000, and, while it has dropped below its 2014 low, the Ratio lows in 2009 and 2011 seem like more reasonable targets at which we could start wondering if the bear market was coming to an end.
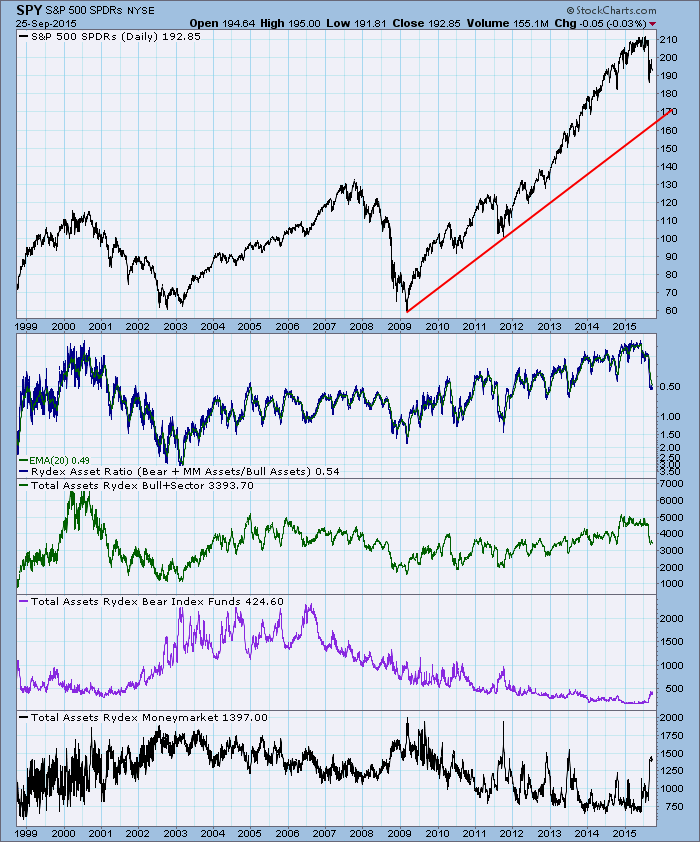
Am I positive that we are in a bear market? No, not positive, but I am reasonably certain that we are. SPY has decisively broken a major trend line (see top chart) and the SPY 50EMA is below the 200EMA (not shown). This is sufficient objective evidence to make the bear market assumption and to expect bearish resolutions more often than not. Based upon that, I ultimately expect to see the Rydex Asset Ratio challenge previous bear market levels.
*Rydex Funds were purchased by Guggenheim Investments several years ago, and the funds no longer bear the Rydex name; however, DecisionPoint still tracks the original group of Rydex funds and continues to use the original indicator name.
Technical analysis is a windsock, not a crystal ball.


