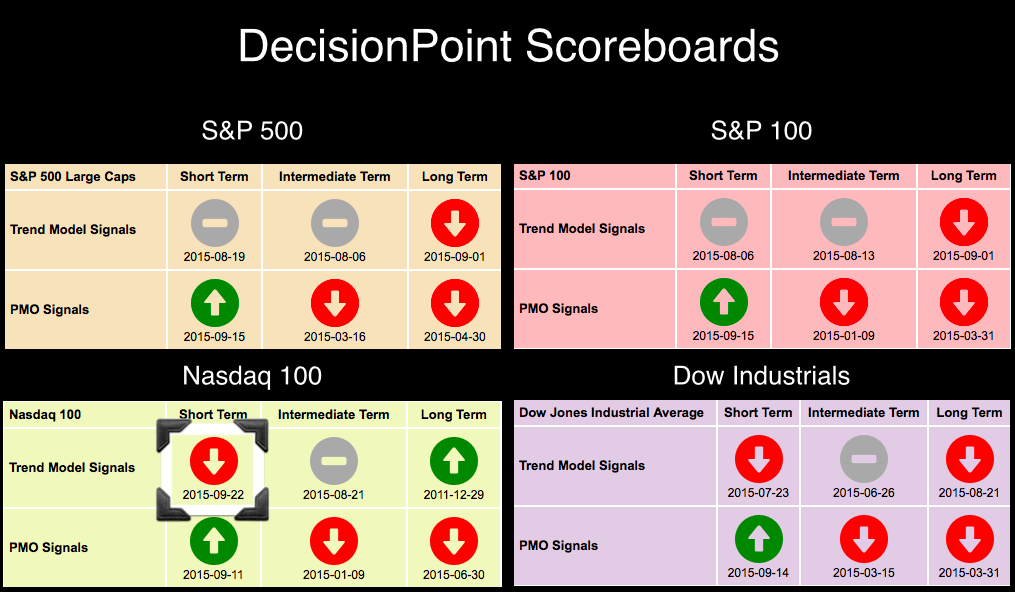
The Nasdaq 100 (NDX) has been the leading index for the recent rally. It was the first to move from short-term Neutral and SELL signals to BUY signals on the DecisionPoint Scoreboards. However, the rally has lost its legs and the NDX is the first show this, whipsawing from a September 15th Short-Term Trend Model (STTM) BUY signal to a SELL signal today.
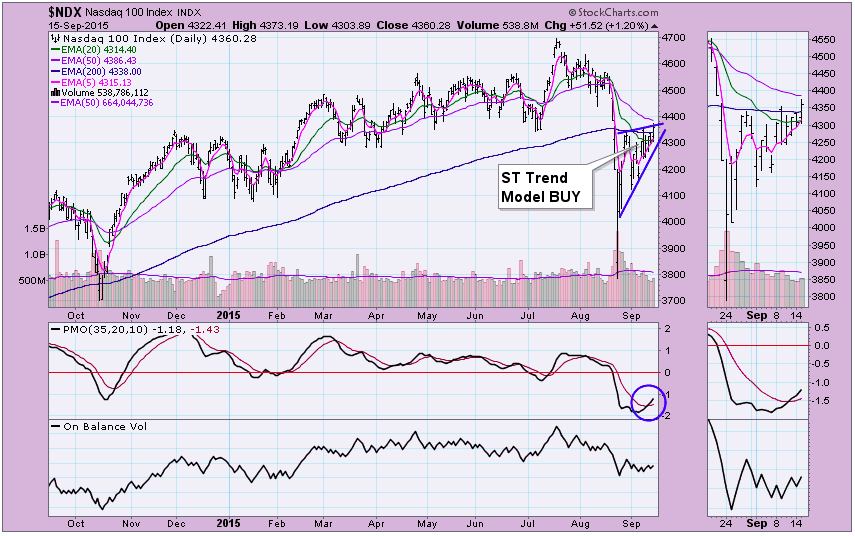
When I reviewed the BUY signal in my September 15th DecisionPoint Alert article, I noted, "I see a problem. Notice the near perfectly formed rising wedge. This is a bearish formation in that the expectation is a break down from the wedge." Here is a static chart of $NDX from 9/15:
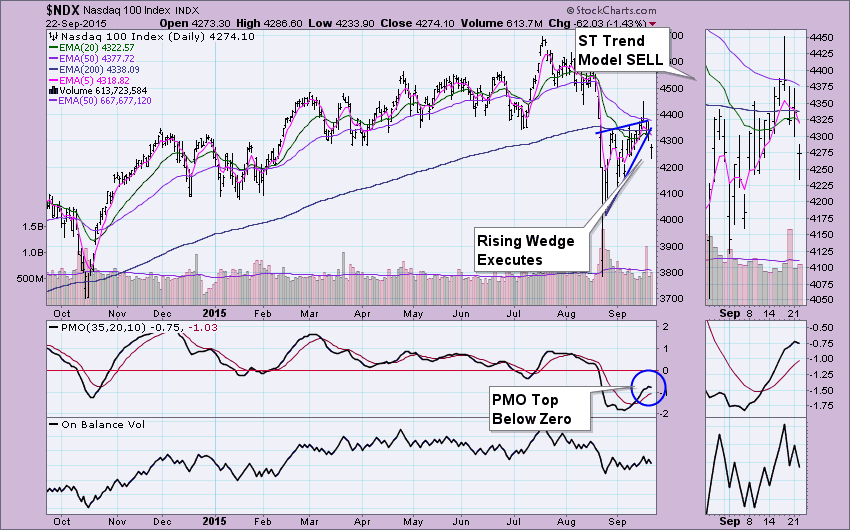
On today's chart you can see that the bearish wedge met its expectation when price broke down. A 3% move would be considered "decisive" but this is significant. What was a fairly bright picture above, is quite bearish below. Not only did we see the failure of the STTM BUY signal and the execution of the wedge, but the Price Momentum Oscillator (PMO), which had just generated a BUY signal when it crossed its signal line, topped. A top is always considered bearish, but a top below the zero line is considered especially bearish.
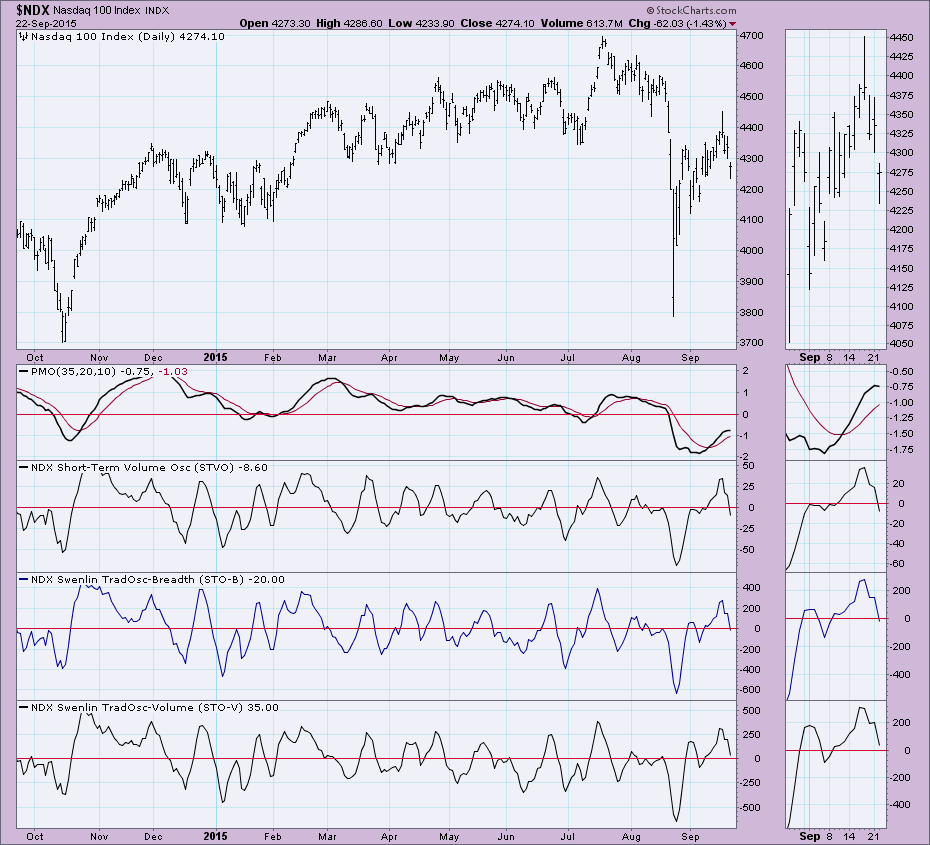
Short-term indicators for the $NDX (found in the DecisionPoint Chart Gallery) are also bearish. They actually gave us warning of today's breakdown when they topped last week. Falling readings in the neutral zone are negative. There is plenty of territory for these indicators to fall, meaning they can accommodate lower prices. For more information on the STVO click here and STOs click here.
Conclusion: With the failure of the NDX to rally off of the recent BUY signals and bearish indicators, I would expect to see the "green" in the DP Scoreboards disappear soon. The NDX is not officially in a "bear market" until the 50-EMA crosses below the 200-EMA. I think that crossover is highly likely when you review the indicators in the DecisionPoint Chart Gallery. I'm looking for a test of the October lows.
Technical Analysis is a windsock, not a crystal ball.
Happy Charting!
- Erin


