As part of a comment on Friday's DecisionPoint Alert, I was asked to review the DecisionPoint sentiment charts. Significant market tops and bottoms are normally accompanied by extremes of sentiment in one direction, and that is a strong indication that the market is about to head in the opposite direction. For example, market participants are extremely bearish at bottoms, just before the market starts to rally. My reader noted that the charts were showing extremely negative sentiment which could be bullish.
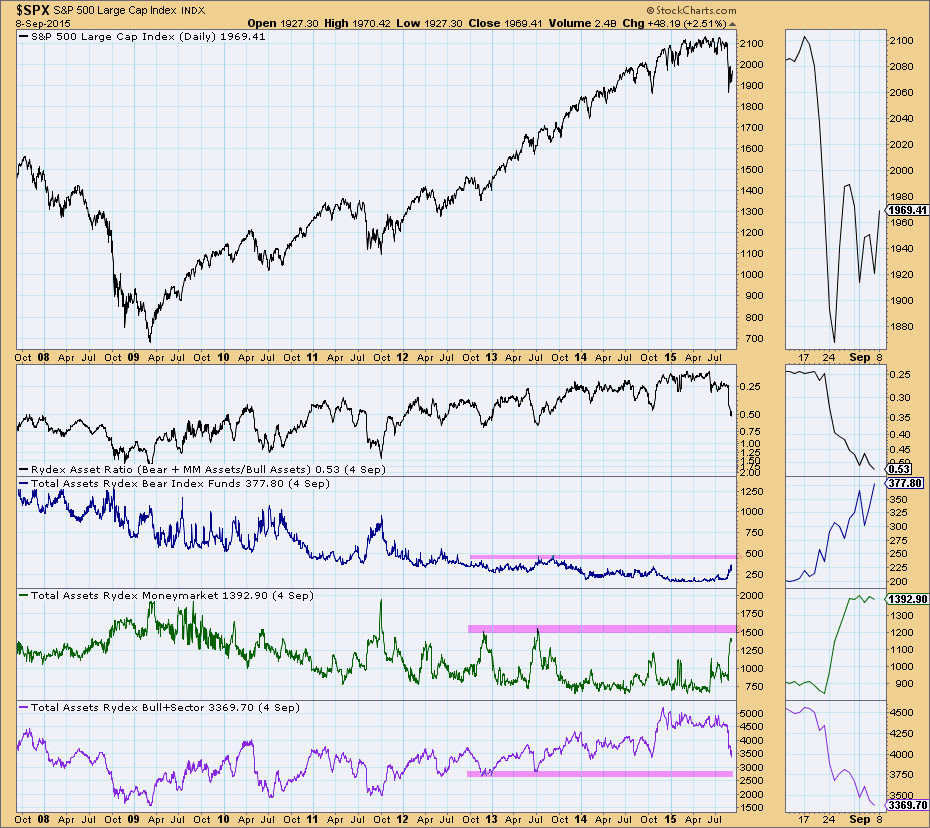
A great measure of sentiment is the DecisionPoint Rydex Ratio. Sentiment has traditionally been measured by taking polls of selected groups of investors, advisors, investing professionals, etc. Rydex is an unusual mutual fund company in that it publishes the total dollar amount of assets in each of its funds on a daily basis. This makes it possible for us to analyze sentiment based upon what investors are actually doing with real money. We do this by calculating a daily bear/bull asset ratio and monitoring the relationship between assets in the two types of funds. The first chart measures what the total assets are in each class. Currently total assets in bear funds has still not reached previous highs experienced in 2009/2011. The Rydex Asset Ratio is about .50 which tells us that there is more money in bull funds currently. When the reading is greater than 1, that tells us there are more assets in bear funds and money markets. Previous readings at 2009/2011 bottoms were nearly 2, meaning in a general sense that for every dollar in a bull fund there were two dollars in a bear fund.
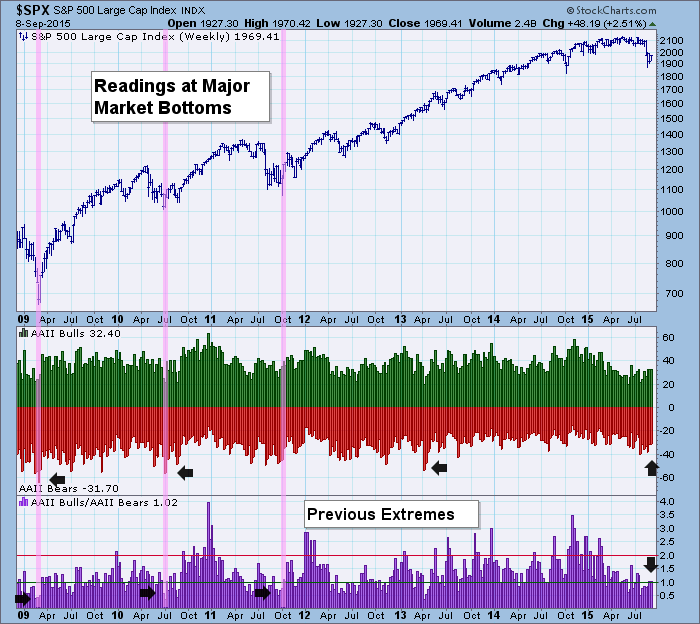
AAII stands for the American Association of Individual Investors. AAII takes a weekly survey by asking its members if they are bullish, bearish or neutral. Readings are not as extreme as the previous market bottoms annotated. The Bull/Bear ratio is 1.02 meaning that there are nearly the same amount of bulls as bears right now. These indicators work best when they hit extremes. AAII sentiment is not there yet.
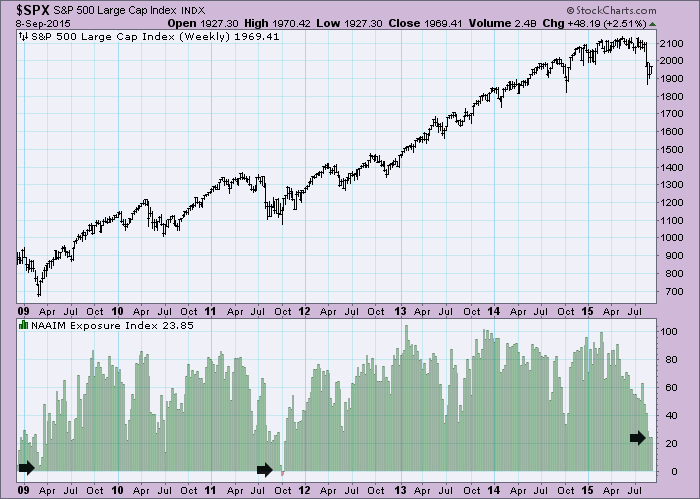
NAAIM stands for the National Association of Active Investment Managers. This professional group reports its exposure to US stocks on a weekly basis. The exposure index reflects the average exposure of NAAIM members. At previous market bottoms, they were not nearly as exposed as they are now.
Conclusion: Yes, sentiment indicators are contrarian, and although readings are sufficiently bearish to normally indicate a market bottom, we saw that these indicators can get even more one-sided or deeply oversold, especially at major market reversals. Observations at previous major market bottoms tell us people aren't bearish enough right now.
Technical Analysis is a windsock, not a crystal ball.
Happy Charting!
- Erin


