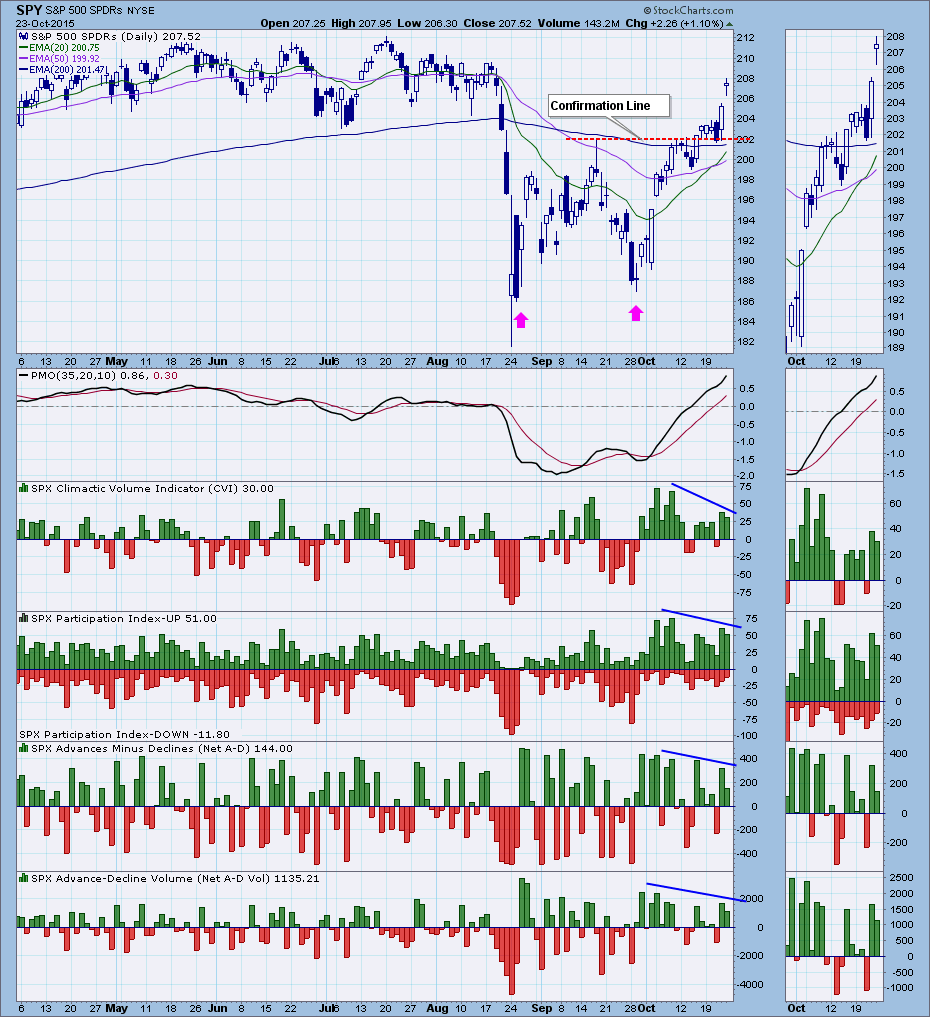
After the strong upside price action we've had in the last two days, I was expecting to see strong internal readings as well. But no. While price is within about two percent of record highs, internal readings are fading.
On the chart above the green bars, which represent positive internal forces, are contracting as price moves higher. I don't consider this to be especially severe, but it indicates that the smaller-cap stocks in the S&P 500 Index are not participating in the rally as much as the larger-cap stocks are, and this is less than ideal.
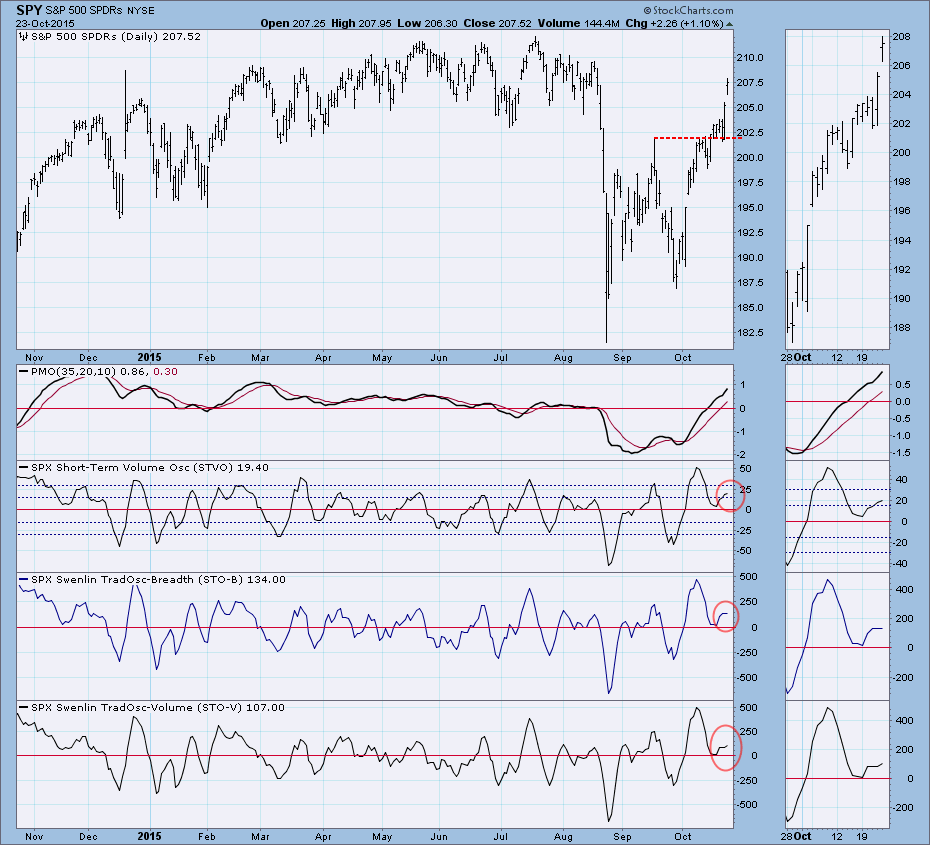
Last week I used the following chart as an example of how strong the market was because price was moving higher while internal indicators corrected. This week I notice that the indicators have bottomed, but higher prices have failed to generate comparable movement in the indicators, which I must now consider to be weakness.
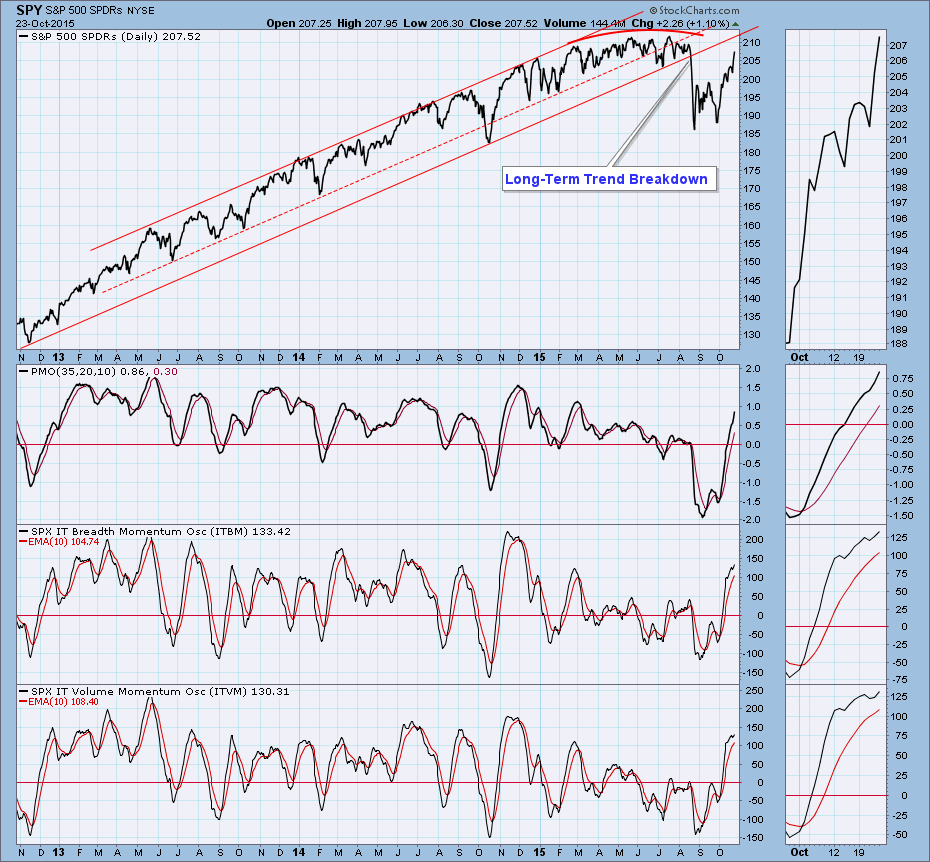
Intermediate-term indicators are becoming overbought, and the ITBM and ITVM have decelerated significantly in the process of twice attempting to top.
CONCLUSION: Because the 50EMA is still below the 200EMA, I must consider the long-term condition of the market to be bearish, but recently it has not been acting in accordance with that label. Nevertheless, short-term indicators show fading strength along with overbought intermediate-term indicators. It would not be unreasonable to expect a rally pause or a pullback.
Technical analysis is a windsock, not a crystal ball.


