 It was pointed out to me that small- and mid-cap stocks were not participating in the recent rally in comparison to the major indexes on our DP Scoreboards that I've recently covered in previous blogs. I called up three charts, the S&P 400, S&P 600 and the Russell 2000 ETF (IWM). It is true, these charts are far from bullish in the intermediate term to long term. Pivotal market reversals generally require small and mid-cap support.
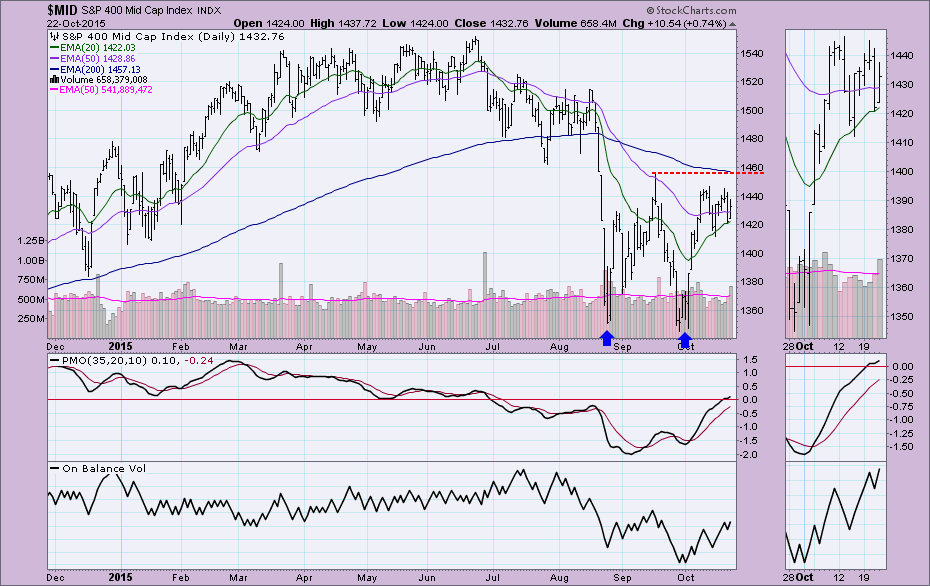
On all three of these charts, the September high is the problem. None of them have been able to penetrate it. In the S&P 400 below, we can see that it didn't even test that high. Notice also that in the case of the smaller caps, there appear to be large double-bottom formations. All have either aborted, as on the S&P 400, or are in the process of. The position of the Price Momentum Oscillator (PMO) is telling at barely above zero. Remember that the DP Scoreboards have the SPX, Dow, OEX and NDX all on Intermediate-Term Trend Model BUY signals. An ITTM BUY signal generates when the 20-EMA crosses above the 50-EMA. You'll note that the 20-EMAs are far enough away from the 50-EMAs that we won't see similar BUY signals for some time. In the case of the $MID, price is toying with support at the 20-EMA. A crossover can't occur until price closes consistently above the 50-EMA.
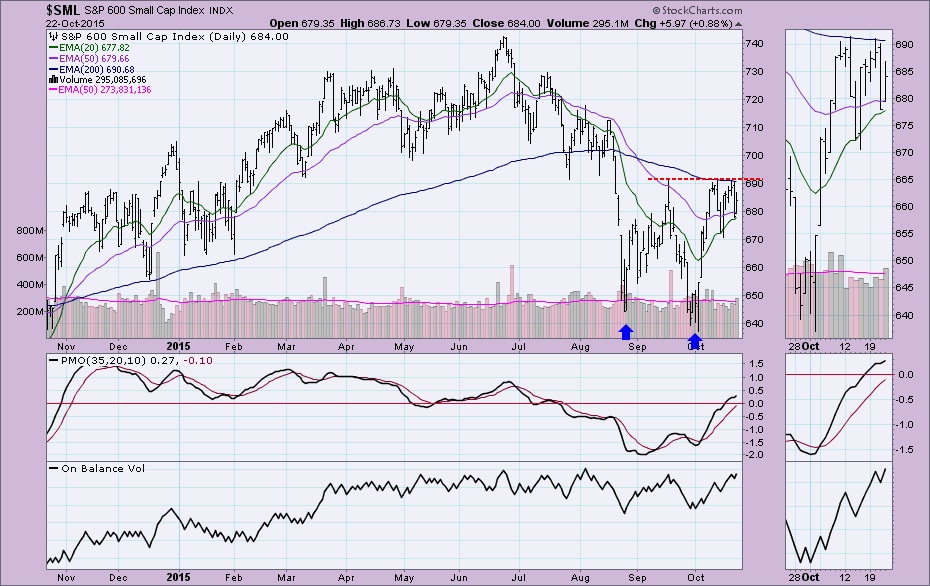
The S&P 600 has a thinner margin between the 20/50-EMAs, so we could see an IT Trend Model BUY. Price twice tried to penetrate the neckline of the double-bottom pattern and failed both times.
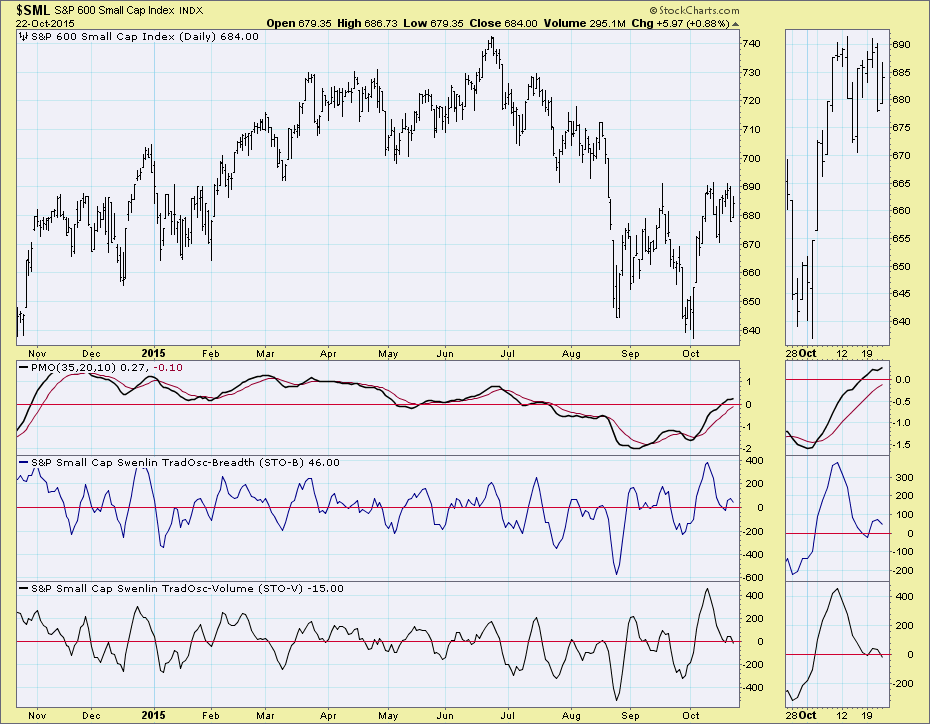
Here's a quick look at the Swenlin Trading Oscillators (STOs) for the S&P 600. Note that they are pointing downward with plenty of time and space to move to oversold territory. Additionally, they have been declining since the rally started, suggesting internal weakness.
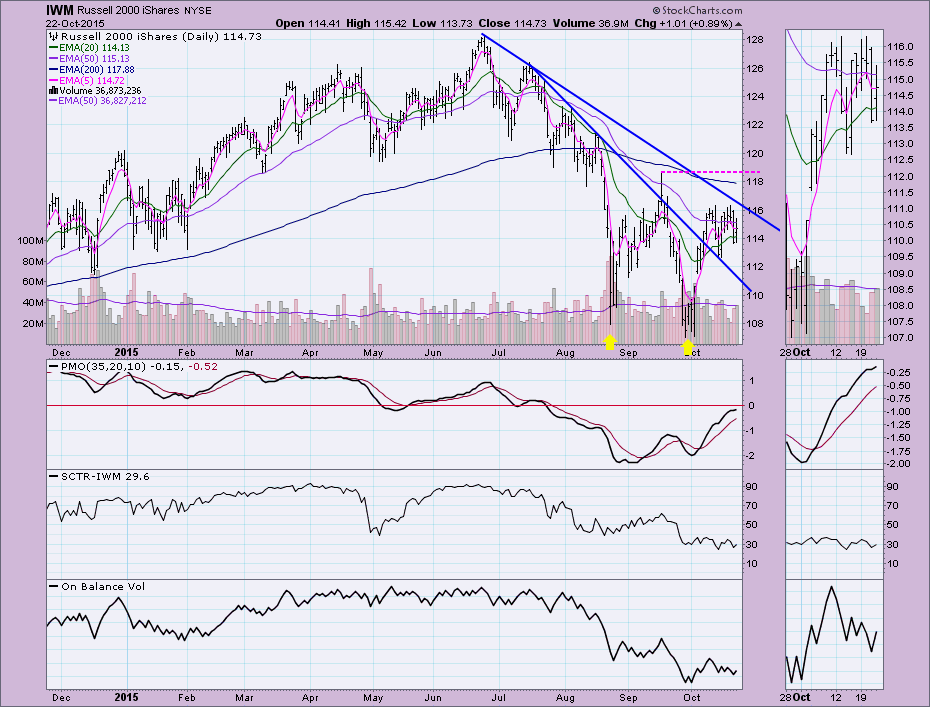
Notice where IWM has found resistance and it is not the September high which it hasn't been tested at all. The declining tops lines have bounded price. Even a break above the declining tops line drawn from the June high would give us some encouragement.
Conclusion: The major indexes on the DP Scoreboards have switched to IT Trend Model BUY signals this week but small- and mid-caps are struggling just to break out above the September highs. As I noted in my DecisionPoint Alert today, a major market reversal will need everyone on board.
Technical Analysis is a windsock, not a crystal ball.
Happy Charting!
- Erin
