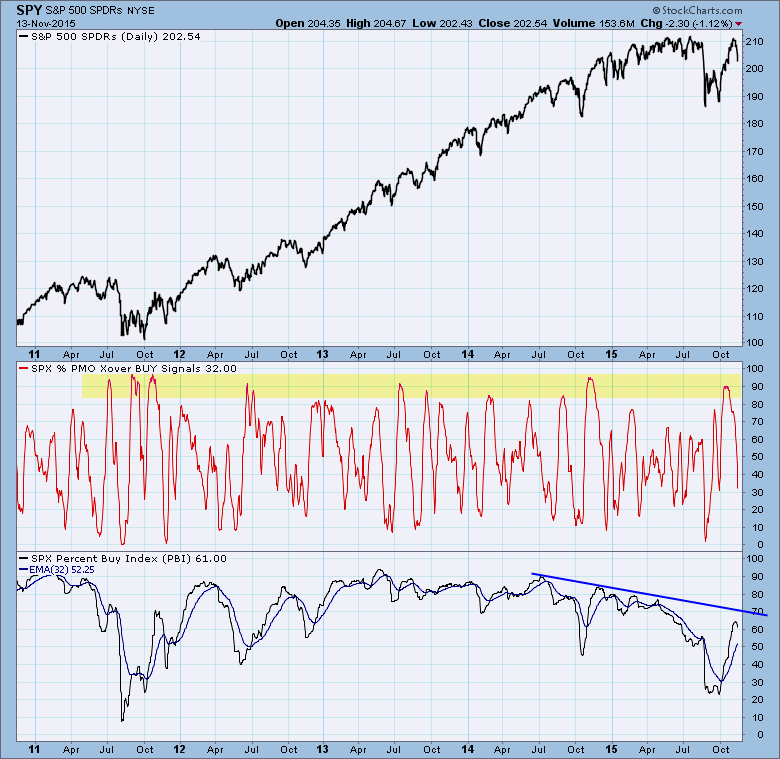
At DecisionPoint we track the status of short-term and long-term mechanical signals so that we can get an idea of the level of participation in each of those time frames. The chart below shows the shorter-term Percentage of PMO Crossover BUY Signals as well as the longer-term Percent Buy Index (PBI) for the stocks in the S&P 500 Index. (The PBI is based upon our Price Momentum Model.)
We can see that the PMO model is a lot more active and that it ranges between extremes of overbought and oversold conditions fairly regularly. Also, when the indicator reaches one extreme or the other, that is a pretty reliable indication that a short-term price reversal is likely. Most recently it reflected 90% of PMO BUY signals, just as the market attempted to reach record highs. The resulting price pullback was not unexpected.
By comparison, the PBI showed that only about 64% of S&P 500 stocks were on BUY signals at the recent price top, reflecting considerable weakness in the longer-term time frame. Notice also that the PBI has been making lower highs for over a year.
CONCLUSION: While the market has been bumping along around new highs for many months, the PBI shows that fewer and fewer individual stocks are participating on a longer-term basis. This means that the price index is being increasingly supported by large-cap stocks, while smaller-cap stocks in the index are losing ground. As long as this condition continues, still lower prices are likely.
Technical analysis is a windsock, not a crystal ball.


