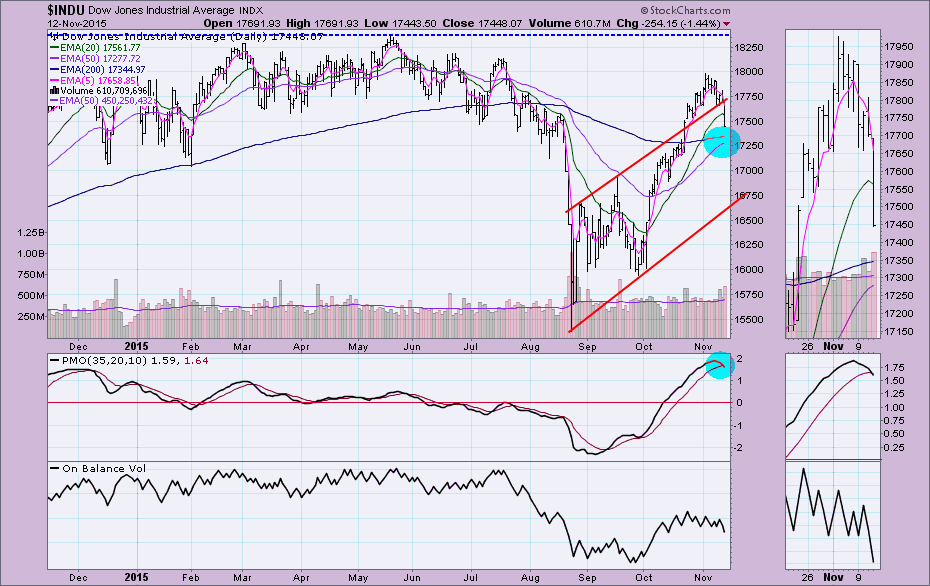
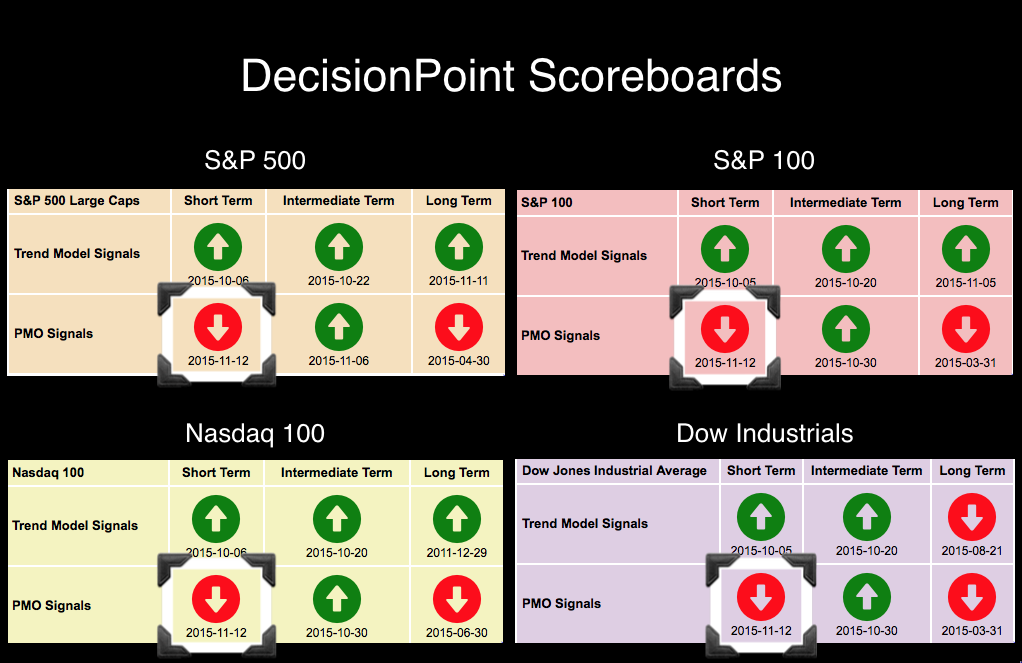
Today the DecisionPoint Scoreboards from our DecisionPoint Chart Gallery lit up with four new Short-Term Price Momentum Oscillator (PMO) SELL signals. I don't think any of us are too surprised (especially those who attended my webinar yesterday!) that so many PMO crossovers occurred on the major indexes. The current pullback not only caused the PMOs to top, but it has yanked the PMOs below their signal lines. Interestingly, this week already has seen two new Long-Term BUY signals arrive ($SPX and $OEX). So what does it mean if the PMO SELL signals appear at the same time as new LTTM BUY signals? It only means that the current market condition is bearish, but the long-term picture is bullish and tells us that any decline will likely be followed by higher prices in the longer term.
The chart with the most problems would be the Dow. Not only did it get a PMO SELL signal today, but it has been unable to move the 50-EMA above the 200-EMA to garner a Long-Term Trend Model BUY signal. The chart is concerning. First, note the blue circle in the price pane, the 50-EMA has decelerated a price has pulled back more than the other indexes. Should price not find support at the 200-EMA, that Long-Term Trend Model BUY signal will not materialize. As with the other indexes, I believe the September high is the best area for support rather than the 200-EMA.
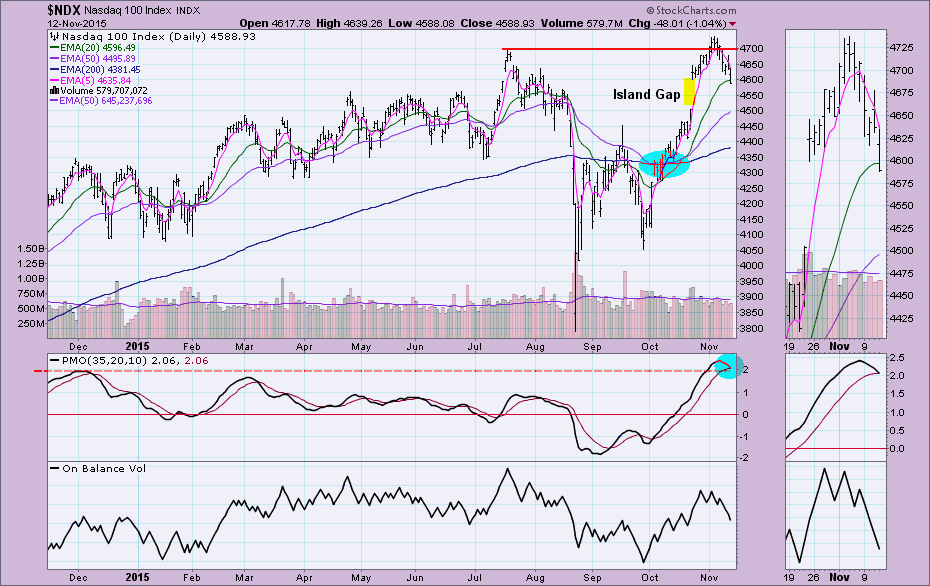
The index that has the best looking chart is the Nasdaq 100. Price is making an attempt to close the gap but it will require some significant decline to even reach its September high. It never had a 50/200-EMA negative crossover, so its been comfortably in a bull market environment despite the correction. The main problem for the NDX is the PMO. While the PMO barely crossed below its signal line (leaving it vulnerable to a whipsaw BUY signal tomorrow), it is extremely overbought and needs some serious unwinding. That can occur on consolidation not just decline, but with it being so overbought I think more pullback will be necessary. Note also the OBV, it is in line with the decline but wasn't behind the rally.
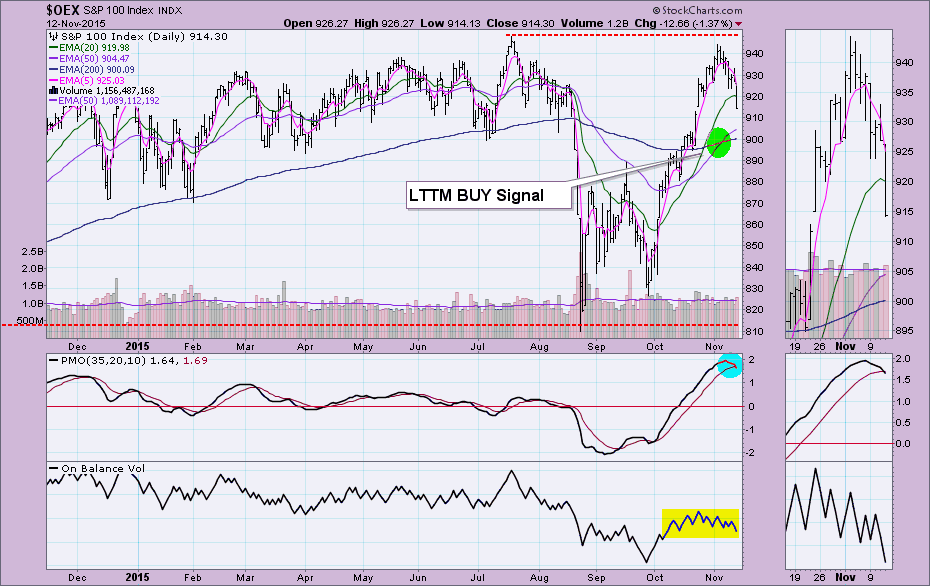
Like the NDX above, the OEX has not quite closed its exhaustion gap from late October which is positive. The LTTM BUY signal is highlighted. In the case of the OEX, the 200-EMA and September high nearly coincide so that would be a great area for support. The PMO is extremely overbought and like all of these indexes, it needs to unwind. I've also highlighted how volume didn't follow the rally. In the thumbnail we can see that the OBV is beginning to back the decline.
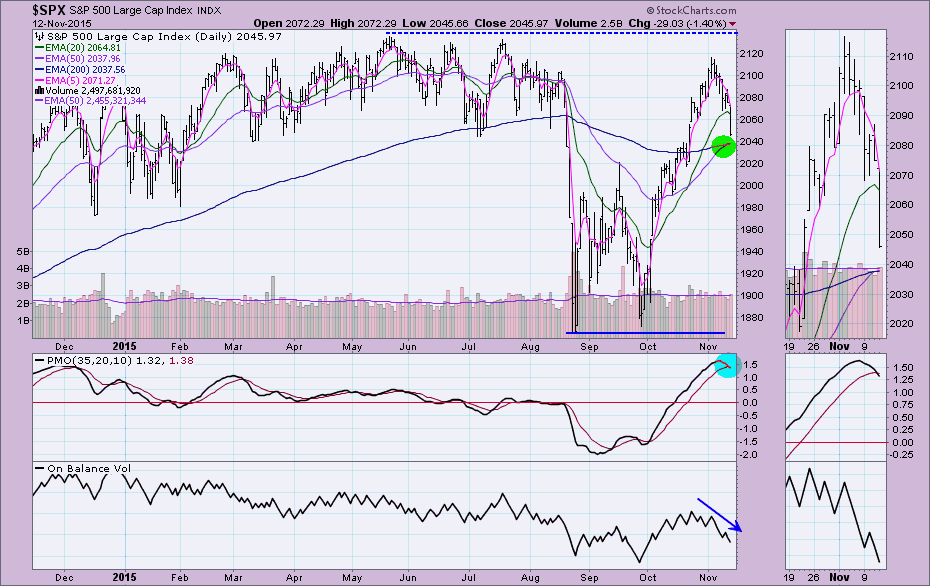
Yesterday's LTTM BUY signal is in jeopardy. Price will likely push past the 200-EMA and the 50-EMA is already slowing. That LTTM BUY signal might be very short-lived. Volume is definitely behind the move as we see the OBV trending lower.
Conclusion: The four new Short-Term PMO SELL signals are characteristic of a pullback. The issue is that all four PMOs need to move out of overbought territory and that will take more decline or at a minimum some consolidation. The LTTM BUY signals that just appeared on the OEX and SPX are already in jeopardy as price plummeted today on both indexes. The question now is how much lower does it have to move for sideline investors to get back in. I don't believe it will take much more decline and it certainly will not require a correction at this point to entice longs back in.
Come check out the DecisionPoint Report with Erin Heim on Wednesdays and Fridays at 7:00p EST. The archives and registration links are on the Homepage under “What’s New”.
Technical Analysis is a windsock, not a crystal ball.
Happy Charting!
- Erin

