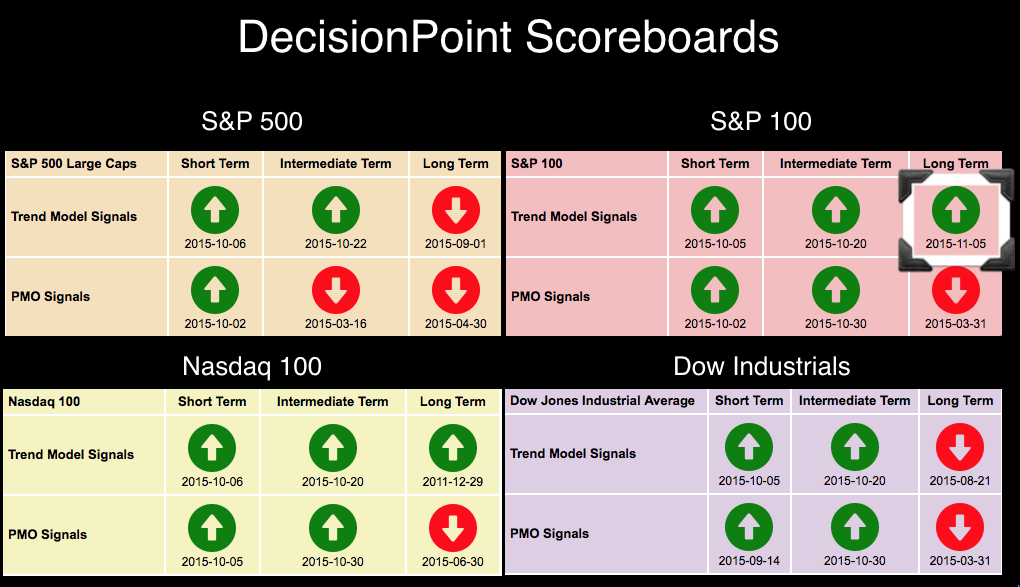
The DecisionPoint Scoreboard Summary below had an important change today. The S&P 100 (OEX) just received a new Long-Term Trend Model BUY signal. This signal generated when the 50-EMA crossed back above the 200-EMA.

This signal is very important as it moves the OEX from a "bear market" to a "bull market". What is the significance? When a stock or index or ETF is in a "bull market" we should expect more bullish outcomes than bearish ones.
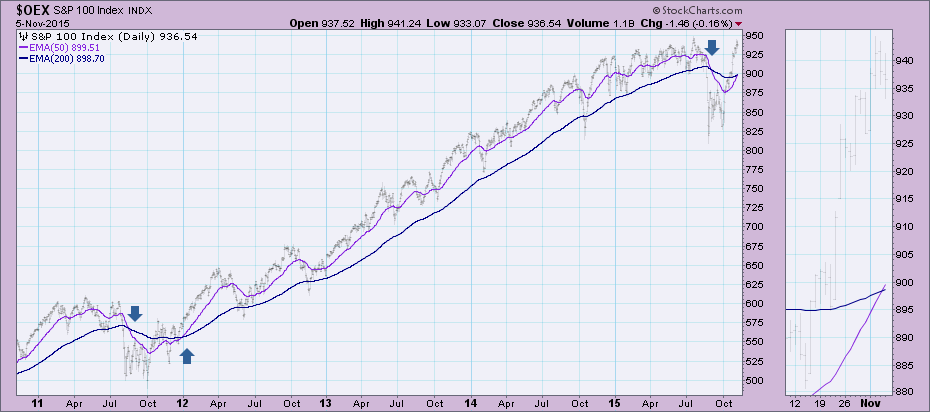
Below is a long-term daily chart of the OEX that focuses in on just the 50/200-EMA crossovers. They occur very infrequently but it did happen briefly during the 2011 correction. Many have compared this correction/bear market to 2011 and I think the resemblance is striking.
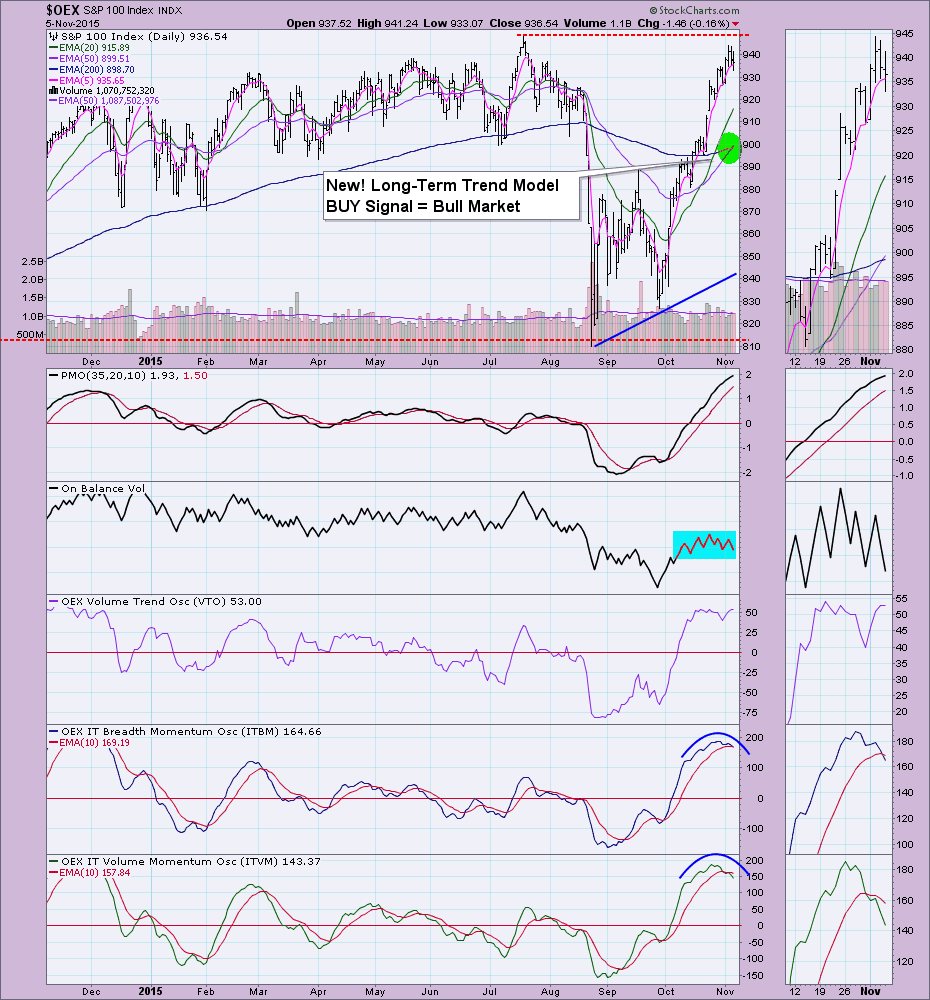
The daily chart below isolates the 50/200-EMA crossover in green. The most telling on this chart is the unsuccessful test of overhead resistance at all-time highs. That resistance is not only technically strong, but it holds psychological traits. Many investors are aware of that resistance and it is posing a problem due to lack of participation in the rally (note the OBV flat volume in blue). There are many on the sidelines and they are waiting for a pullback or correction before jumping on the rally train. A pullback would provide a loosening of indicators that are overbought like the Price Momentum Oscillator (PMO). I invite members to take a look at the other indicator charts in the DP Chart Gallery for the S&P 100. Below I included our intermediate-term indicators. They are overbought and in need of unwinding.
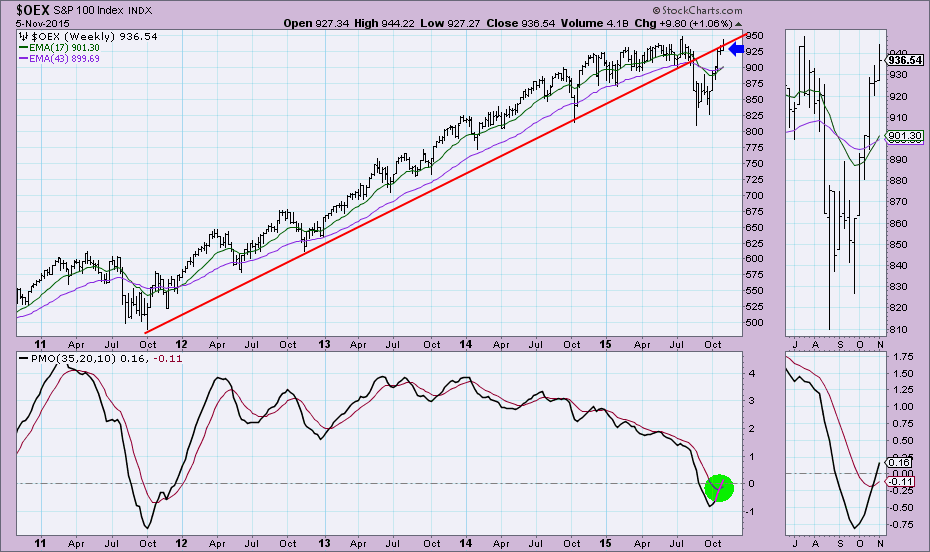
The weekly chart will not go final until tomorrow afternoon, but a quick peek shows that price managed to break above the rising bottoms support line, the 17-week EMA crossed back above the 43-week EMA and the PMO appears to have a positive crossover BUY signal on tap.
Conclusion: The new Long-Term Trend Model BUY signal is very important as it puts the S&P 100 into an official "bull market" phase. While we should expect more bullish outcomes than bearish ones, the rally is overextended and is need of a pullback to unwind overbought indicators and entice the more risk averse away from the sidelines. Everyone, small caps, sectors, etc. will need to get on board for the rally to continue. I doubt they will until large-caps have a pullback.
Come check out the DecisionPoint Report with Erin Heim on Wednesdays and Fridays at 7:00p EST. The archives and registration links are on the Homepage under “What’s New”.
Technical Analysis is a windsock, not a crystal ball.
Happy Charting!
- Erin


