 Many of you have been watching the DP Scoreboards in the DecisionPoint Chart Gallery (SPX, OEX, NDX and Dow). Today, the Long-Term Trend Model moved to a BUY signal on the SPY. The 50-EMA crossed above the 200-EMA, moving it from a bear market environment back into a bull market environment. This distinction is important as it changes the bias from bearish to bullish. The Scoreboard for the S&P 500 did not get the same signal. Additionally, the OEX and Dow have not relinquished their Long-Term Trend Model SELL signals yet, so there is a bearish bias in most major markets. The NDX never had the negative 50/200-EMA crossover so it remains in a bull market environment.
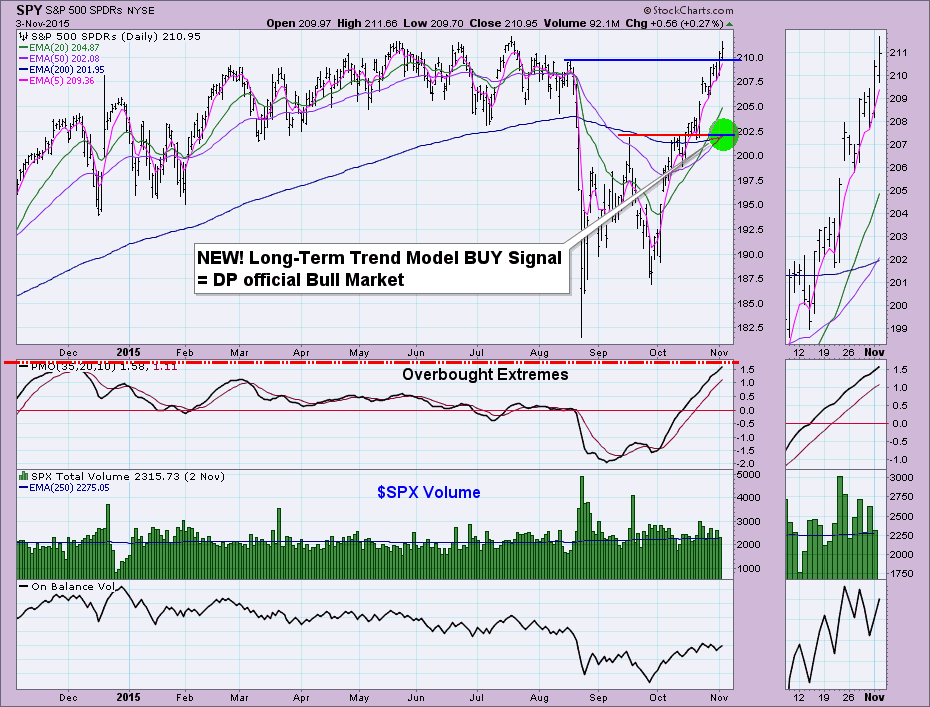
Before we look at the chart for the SPY, I'd like to explain why you would see a crossover on the SPY but not on the SPX. Remember that the SPY is adjusted for dividends because it is an ETF, therefore when you compare it to an index like the S&P 500, you will find that the ETF version is usually more "active", so crossovers will nearly always occur at different times. DecisionPoint timing signals are based off of the SPY, not the SPX, so the official long-term posture for stocks is "bullish" after the positive 50/200-EMA crossover that moved the Long-Term Trend Model to a BUY.
It was very positive to see price trade and close above support at the last high before the crash. Now price is pushing up against overhead resistance at all-time highs. The Price Momentum Oscillator (PMO) continues to climb even as it has reached overbought extremes. Whether a bear market environment or a bull market bias, this rally is extended and in need of a pullback or correction. With the new LT Trend Model BUY signal, I would look for a pullback not necessarily a large correction or crash. The OBV has moved higher slightly and slowly during this last rally, but the participation based on volume was not impressive. Carl pointed out the negative divergence on the OBV in his last article, "Market on the Verge of Something".
The SPX certainly is very similar to the SPY chart, as it should be, but you can see that there is still about a 0.50% spread between the 50/200-EMAs. The OBV and price divergence are clear on this chart when you look at the price action in yellow that occurred versus the activity of the OBV, also in yellow. All-time highs are going to be difficult to achieve with a PMO that is very overbought.
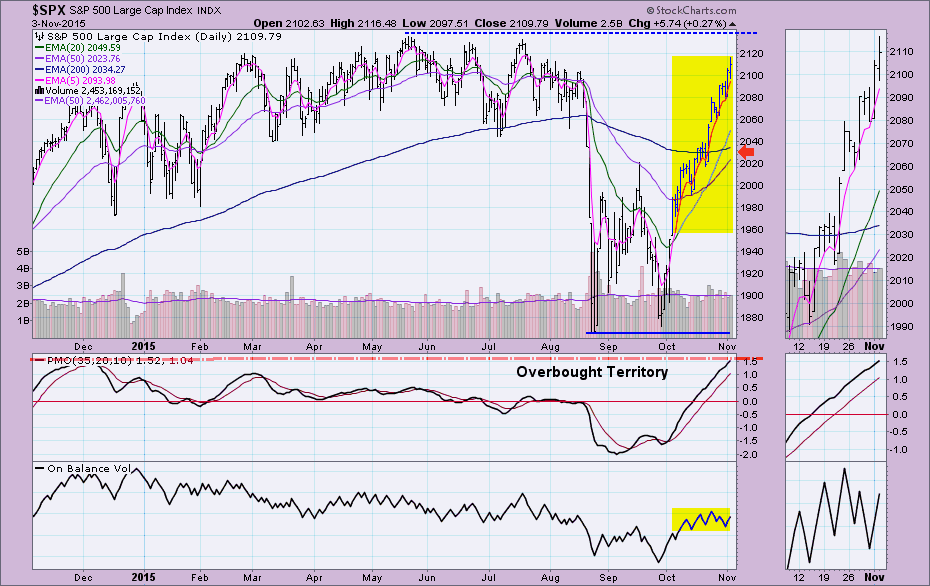
Conclusion: While the SPY did move to a "bull market" with the new Long-Term Trend Model BUY signal, the SPX has not followed suit. I suspect given the negative divergence with volume and the very overbought PMO that prices will pullback before the new Long-Term Trend Model BUY signal materializes. However, as long as price stays above the 200-EMA, the positive crossover will eventually occur. I invite you to check out today's DecisionPoint Alert to see the DP indicators' reaction to the new BUY signal. Signs continue to point to a break down of this rally. The longer it goes the more tenuous its continuation.
Come check out the DecisionPoint Report with Erin Heim on Wednesday’s and Friday’s at 7:00p EST. The archives and registration links are on the Homepage under “What’s New”.
Technical Analysis is a windsock, not a crystal ball.
Happy Charting!
- Erin
