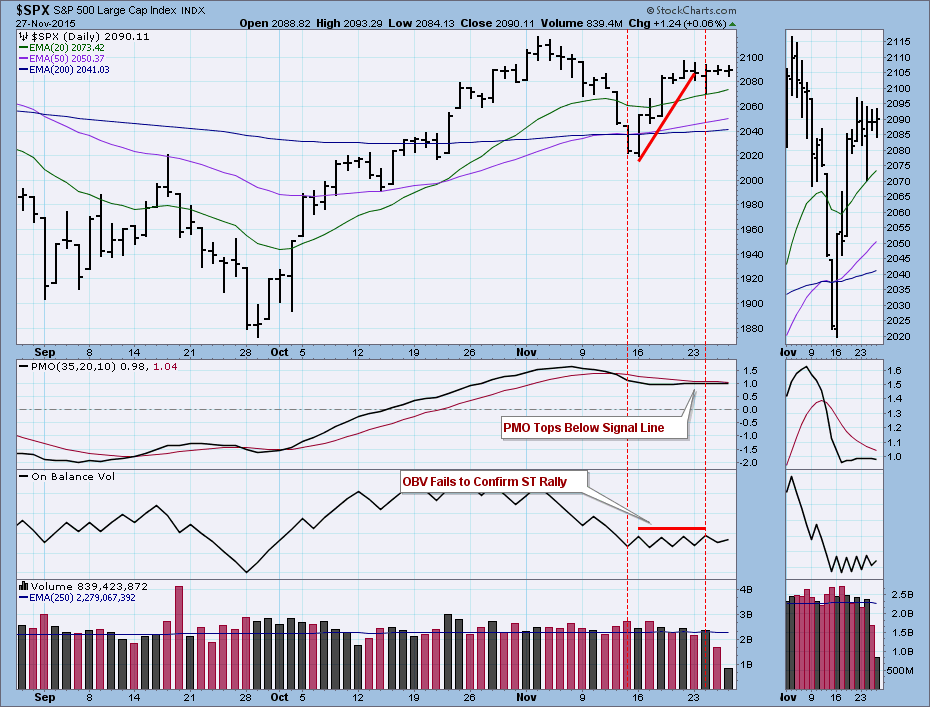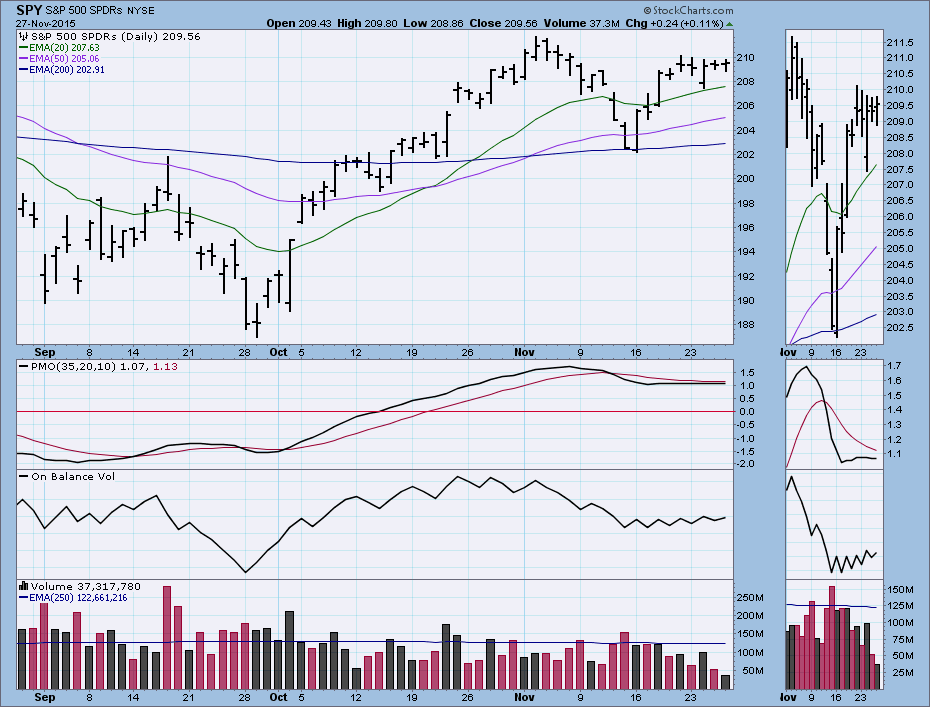
When performing index analysis, I normally prefer to use the SPDR because that is the trading vehicle, as well as a "total return" view of the index. In this case we are looking at on-balance volume (OBV), and I wanted to be sure we were considering all the volume associated with the index, not just the volume of the SPDR.
As the rally from the November low progressed, I noticed that the OBV was moving sideways rather than moving up to confirm the rally. I was a little wary of this analysis because volume tends to be low during a holiday week; however, except for the last two trading days, volume has been quite robust, staying right around the 250EMA of volume. Strictly speaking, a true OBV non-confirmation occurs when price puts in a higher top that is accompanied by a lower OBV top, but in this case I thought that the disparity between OBV and price was so pronounced that it was worth a mention.
In addition to the OBV problem we can see that the PMO (price momentum oscillator) is topping below the signal line, always considered a bearish sign.
Taking a quick look at the SPY chart, we see similar readings, except daily volume has been substandard, running well below the 250EMA for almost two months. This is why I thought it better to focus on $SPX volume.
CONCLUSION: The S&P 500 Index is not far from making new, all-time highs, but OBV and PMO configurations are bearish. While this could be the beginning of a longer-term breakdown, I should emphasize that these problems only have short-term implications at this point. An extension of the current rally once post-holiday trading resumes could erase these issues rather quickly. For now, these are caution flags.
Technical analysis is a windsock, not a crystal ball.


