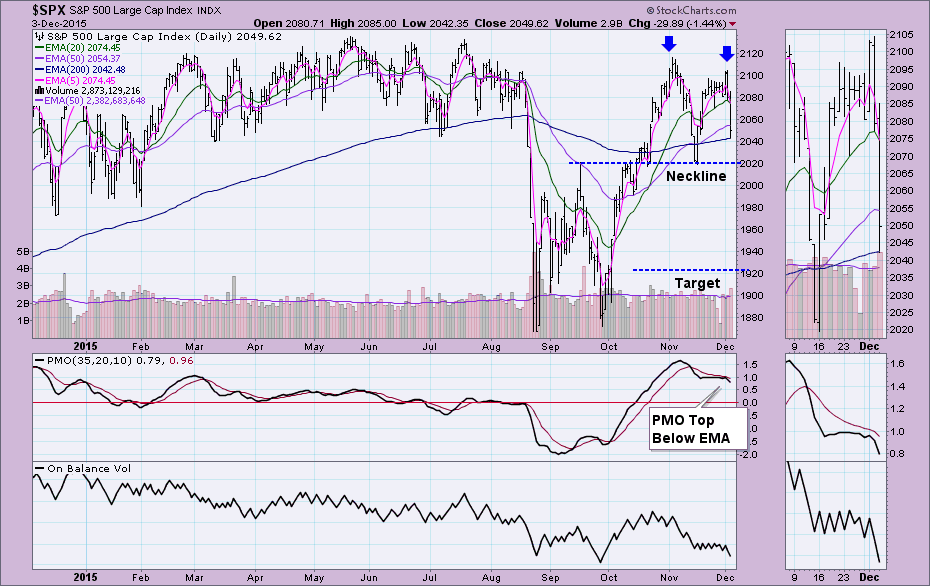
I purposely have not mentioned the possible double-top formation on the SPY in the DecisionPoint Alert and in my webinars on Wednesdays and Fridays. I felt it was too early and indicators weren't looking bearish enough to discuss not only a drop to the "neckline" but a plunge to the expected minimum downside target. Today after the crash, it is impossible not to discuss these formations as they are on most major index charts.
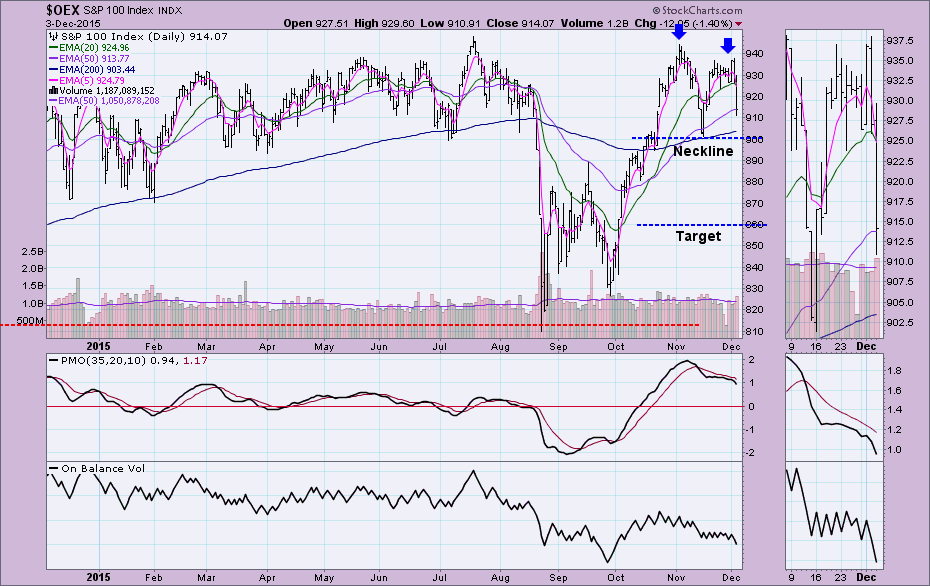
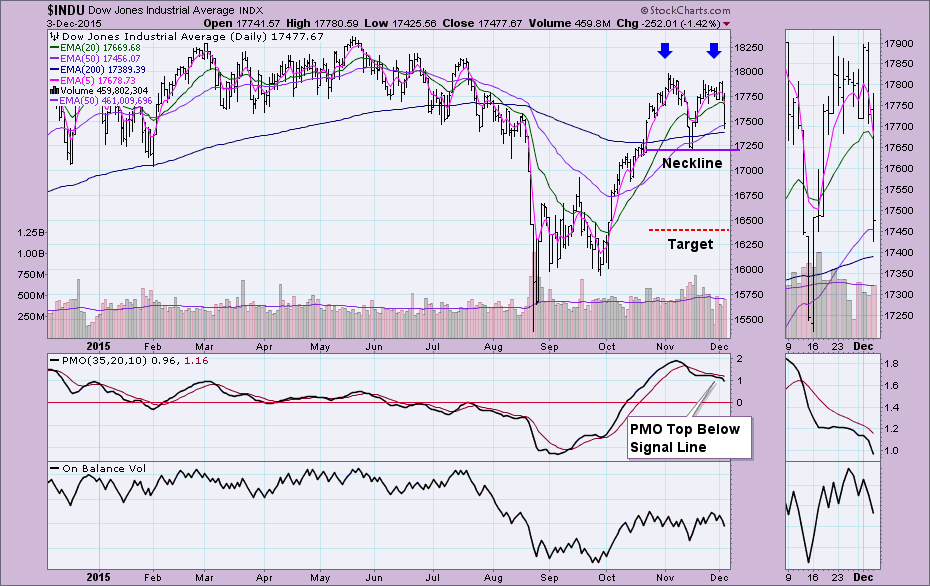
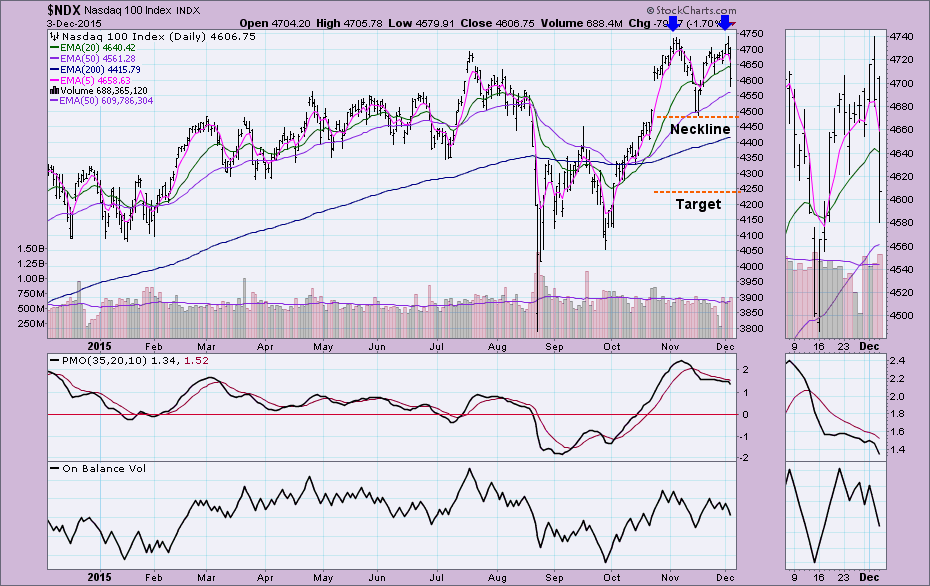
Below are the daily charts of the four large-cap indexes that we cover in the DecisionPoint Chart Gallery. You'll see that all of them have double-top formations. I've annotated not only the neckline of the formations, but also an estimate of the minimum downside target. I'd like to highlight the S&P 100 chart below because it received a Short-Term Trend Model Neutral signal today as the 5-EMA crossed below the 20-EMA while it was above the 50-EMA; had it been below, it would've been a SELL signal. All four indexes in all three time frames have been on BUY signals. The OEX just produced the first negative signal.
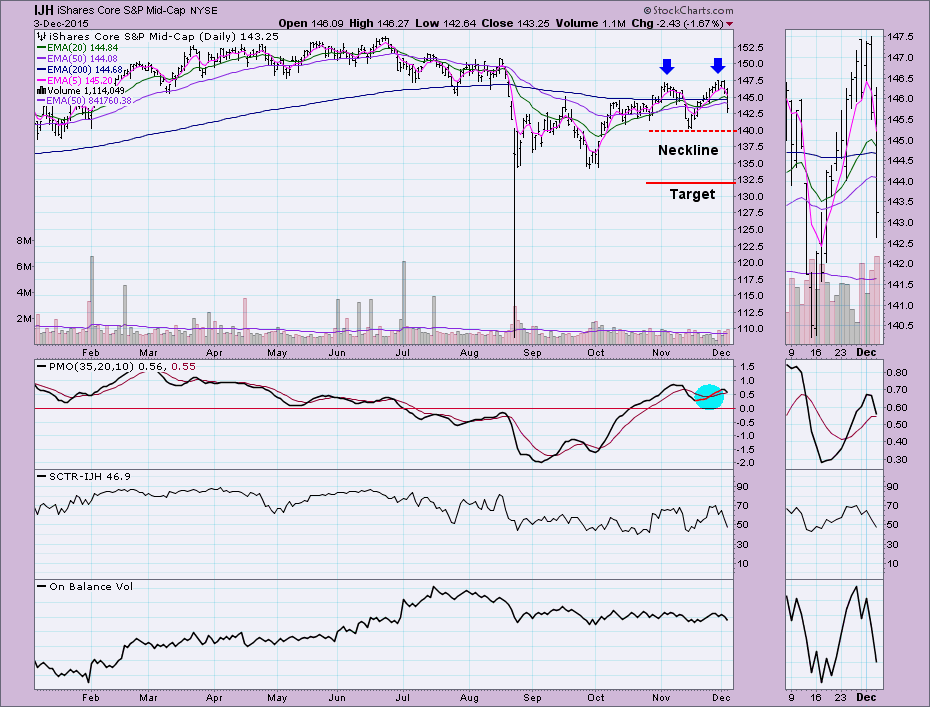
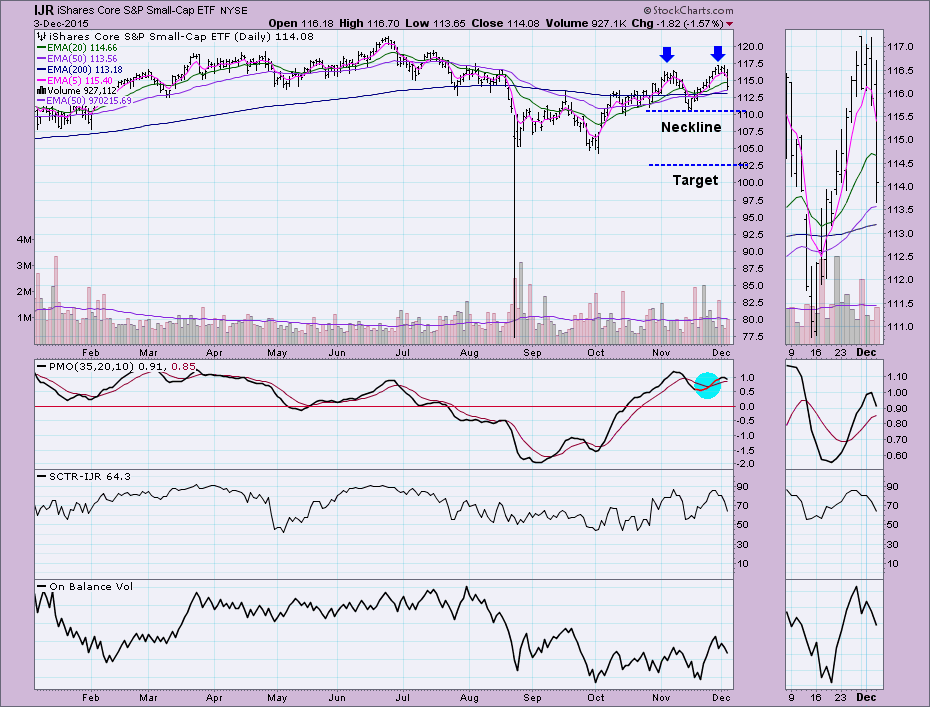
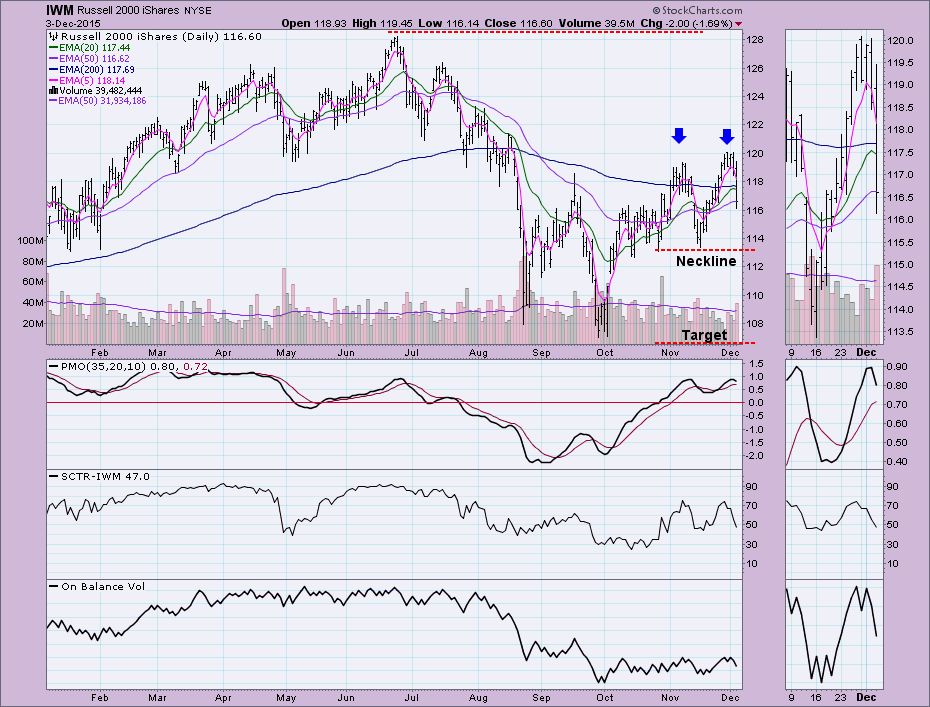
The large caps are not the only indexes showing double-top formations. Small and Mid Caps also have double-top formations:
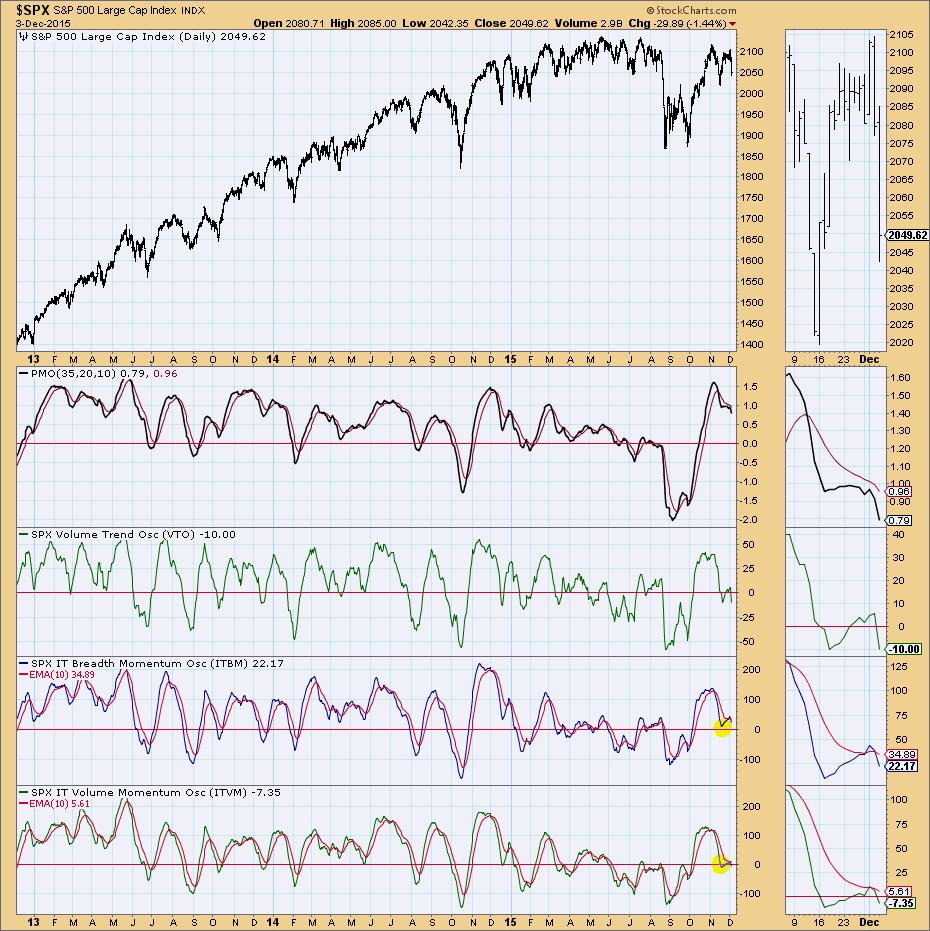
I asked the question in the title whether these double-top formations would execute and pan out. I have little doubt that the necklines will be tested. When I look at our short-term indicators below, they are sitting in neutral not oversold. They need more downside to get to desirable oversold extremes. Short term is generally defined as days to a few weeks. This tells me that they should drop below the neckline.
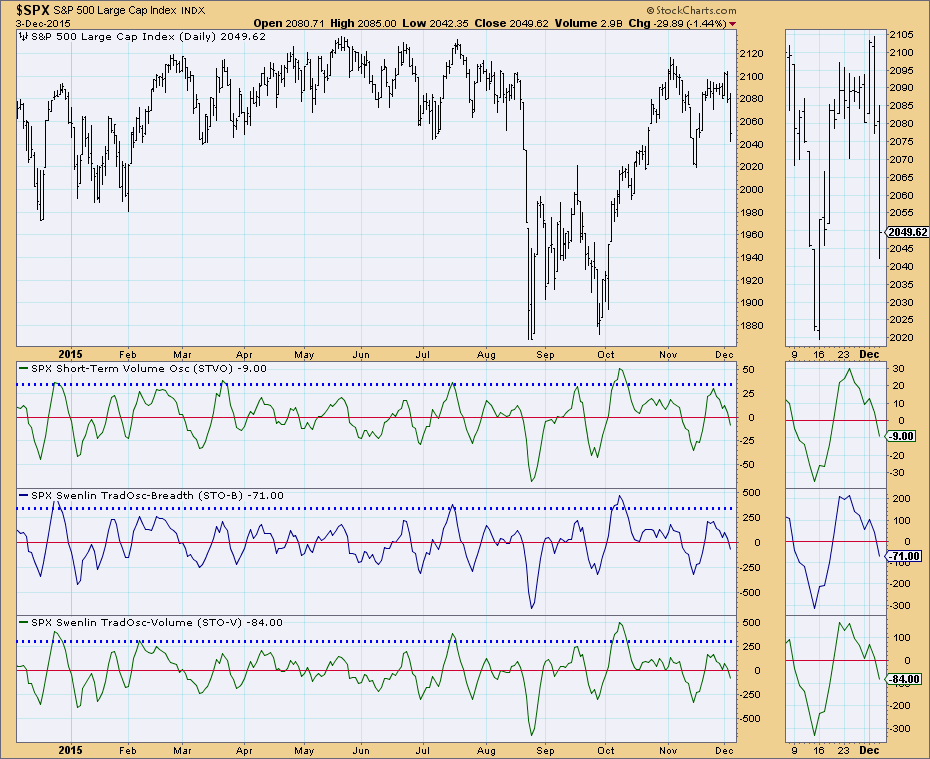
Intermediate term is defined in weeks to a few months. Notice that our intermediate-term indicators below are also neutral and falling. This suggests that the minimum downside targets could very well be met.
Come check out the DecisionPoint Report with Erin Heim on Wednesdays and Fridays at 7:00p EST. The archives and registration links are on the Homepage under “What’s New”.
Technical Analysis is a windsock, not a crystal ball.
Happy Charting!
- Erin


