The Nasdaq 100 has been a superstar since the August low; price even managed to reach new all-time intraday highs. The saying goes the bigger they are, the harder they fall. Well, let's review the price chart and indicators specifically for the NDX. You can find these in the DecisionPoint Chart Gallery if you are a member.
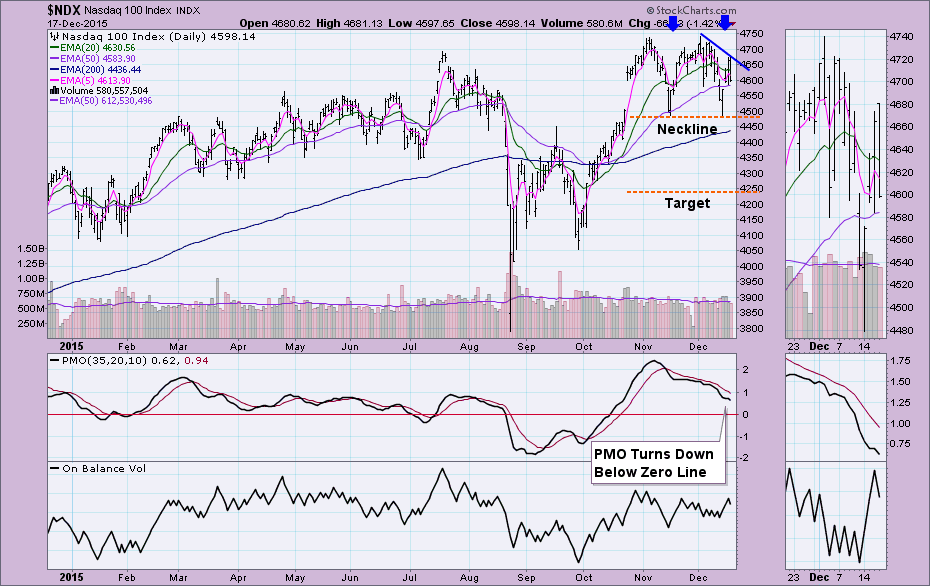
A double-top has formed on nearly all market indexes regardless of cap weighting and the NDX is no exception. Price bounced nicely off of the double-top neckline, though not enough to break above the declining tops line. This is somewhat of a surprise since the Dow Industrials, the OEX and SPX did penetrate their declining tops lines. This isn't the end of the world as it was only intraday highs at the start of the trading session that caused those breakouts. Adding insult to injury, the Price Momentum Oscillator (PMO) topped below its signal line. The double-top formation suggests a minimum downside target around 4250. I do believe this target will be tested, but likely not until after the holidays based on the indicator charts.
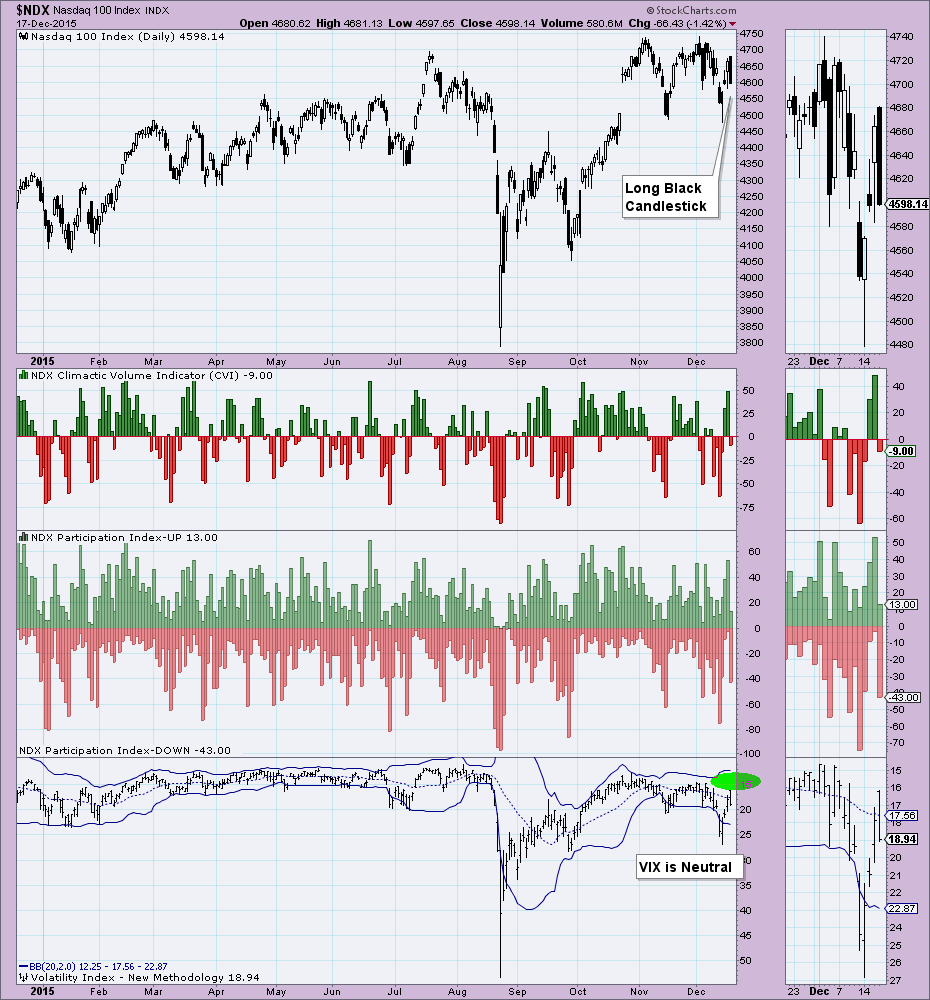
Today's long black candlestick shows that there was strong selling pressure. From the ChartSchool article on candlesticks: "The longer the black candlestick is, the further the close is below the open. This indicates that prices declined significantly from the open and sellers were aggressive. After a long advance, a long black candlestick can foreshadow a turning point or mark a future resistance level." The Participation Index - DOWN had a somewhat climactic reading, but it was not accompanied by a similar bearish reading on the CVI. This could be telling us that an initiation to lower prices should occur. Had the CVI had a climactic reading too, I would feel much more confident about this being an initiation impulse. Additionally, another factor that leaves me less confident about calling a deep decline would be that the VIX is not yet testing the upper Bollinger Band. Generally, at major reversals, VIX readings are near or past the upper or lower Bollinger Bands.
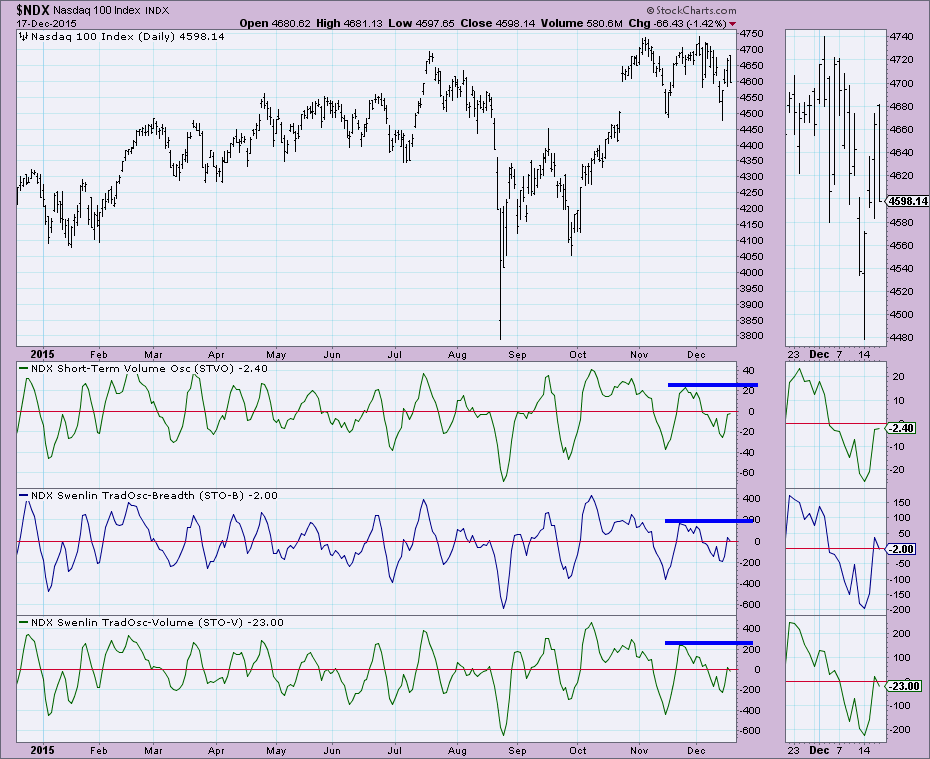
The Swenlin Trading Oscillators (STOs) turned down below the zero line which is bearish. However, it was on a tick down, the VTO is still rising and the STOs are in neutral territory. These indicators need to become at least a little overbought. This wouldn't require a deep correction. Remember that consolidation or churn will also get these indicators to move higher. Their hesitation and location tells me to expect sideways movement during the holidays, which makes sense.
All intermediate-term indicators have turned down below their signal lines. This is very bearish. Also notice that these indicators are neutral. This is very bearish for the intermediate term.
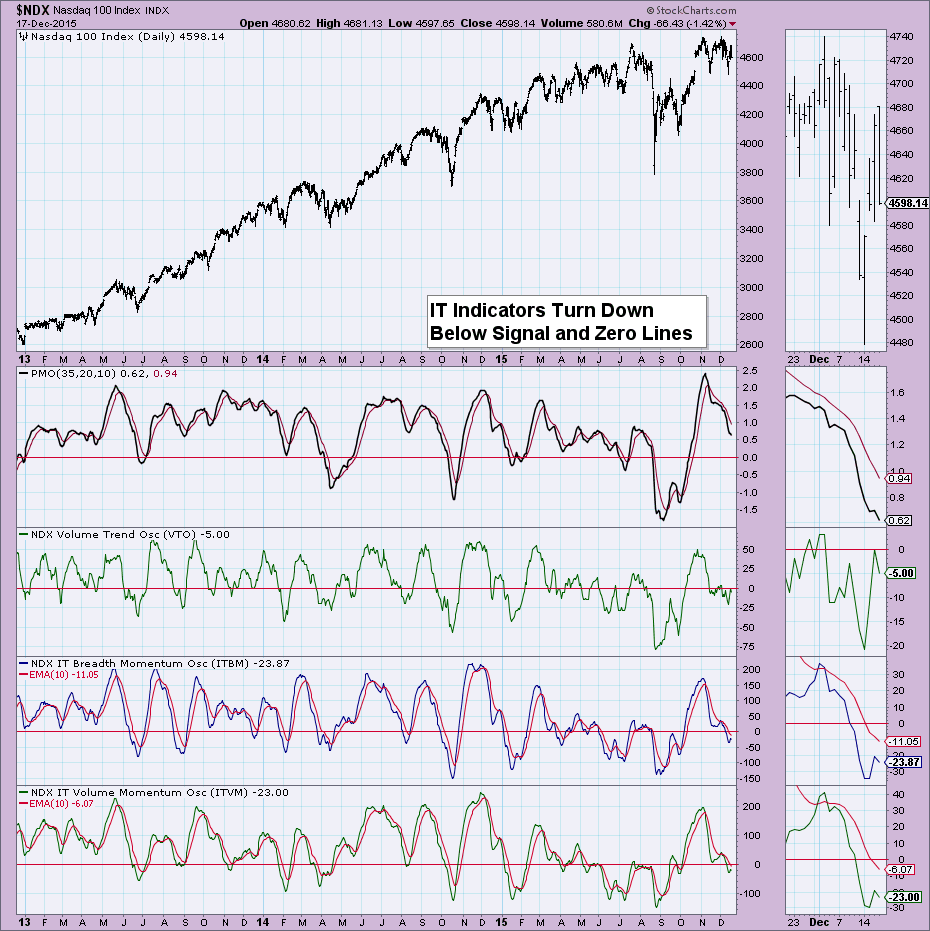
My conclusion for the Nasdaq 100 is the same for the SPY. I expect to see some consolidation or churn through next week as holiday trading is generally less exciting. It may not take the whole week before the impending correction begins. There should be a correction. Just look at the intermediate-term indicators again or pull up a monthly chart for the NDX and review the PMO configurations. Momentum is sinking.
Come check out the DecisionPoint Report with Erin Heim on Wednesdays and Fridays at 7:00p EST. The archives and registration links are on the Homepage under “What’s New”.
Technical Analysis is a windsock, not a crystal ball.
Happy Charting!
- Erin


