Despite today's rally, the S&P 600 ETF (IJR) logged a new Long-Term Trend Model SELL signal. This moves IJR officially into a bear market. The Long-Term Trend Model generates a SELL signal when the 50-EMA crosses below the 200-EMA. DecisionPoint Analysis considers any stock, index, ETF, etc. that has a 50-EMA below the 200-EMA is in a bear market.
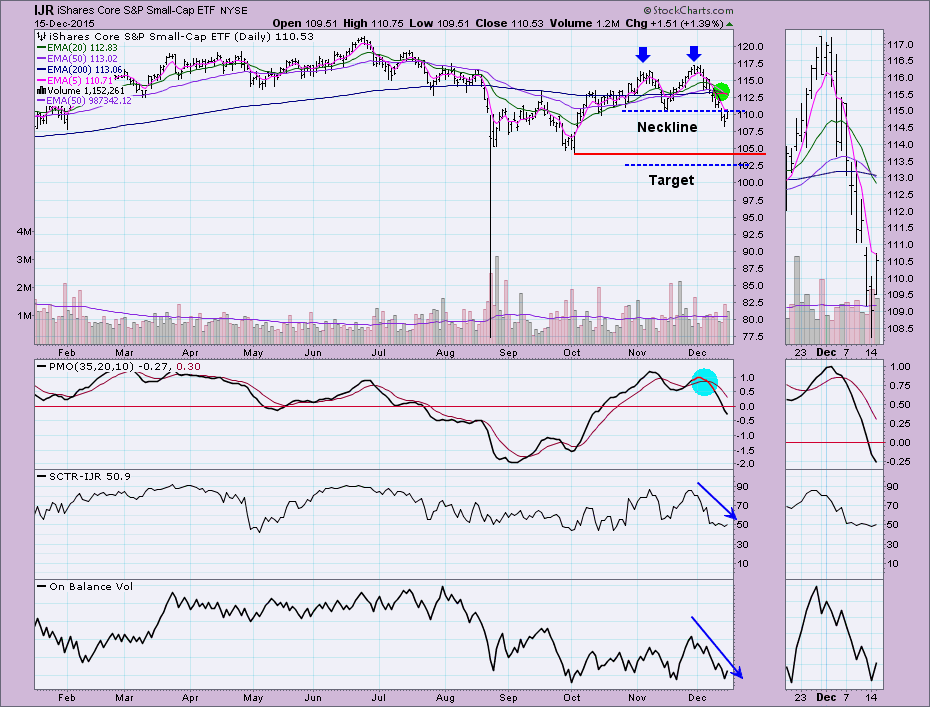
The daily chart for IJR shows the 20/50/200-EMAs all intersecting over the past two days. You can see the new Long-Term Trend Model SELL signal in the thumbnail where the purple 50-EMA crossed below the blue 200-EMA. Yesterday, an Intermediate-Term Trend Model Neutral signal was generated. It missed being a "SELL" signal by only a day. When the 20-EMA crosses below the 50-EMA and it is ABOVE the 200-EMA, it is a Neutral signal. Yesterday the 50-EMA was above the 200-EMA, today it's not. The double-top is what dominates the chart. These are bearish formations. The pattern expectation is that price will break down below the neckline and reach to at least the minimum downside target. Price broke below the neckline yesterday, effectively executing the pattern. Although IJR rallied today, it was not able to close above the neckline. The Price Momentum Oscillator (PMO) is still falling and is now below the zero line which is bearish. Both the SCTR and OBV have been solidly behind this last price decline.
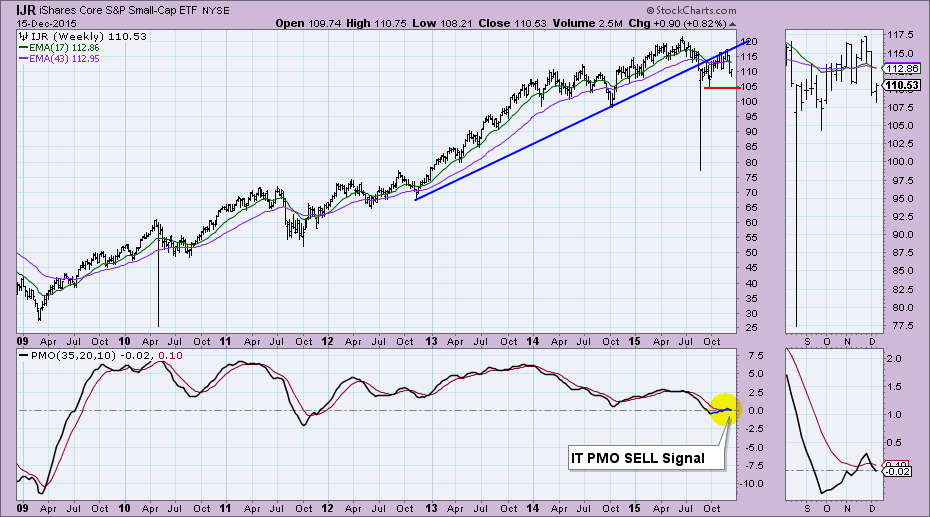
The weekly picture doesn't brighten. The weekly PMO aborted an intermediate-term BUY signal and is now reading below the zero line. Price has been unable to get above the rising bottoms trend line drawn from the 2012 4th quarter low. The September low seems to be the best area for support. This lines up closely with the minimum downside target calculated on the daily chart above.
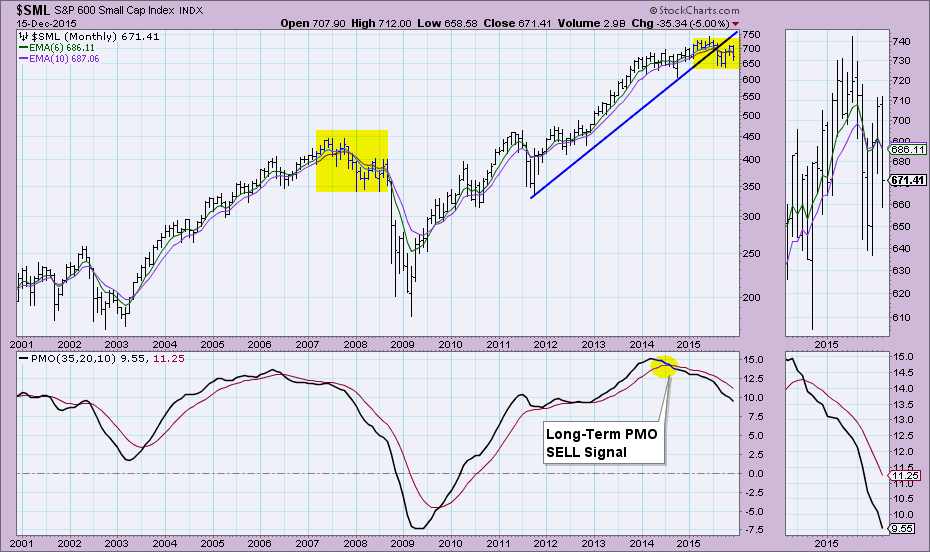
The monthly chart is negative as well. The monthly PMO is declining after a 2014 SELL signal. I've highlighted in yellow boxes what I see great similarities between the 2008 bear market set-up and this year's price action. It doesn't appear we are out of the bear market "woods" yet for the overall market. IJR is not the only small- and mid-cap ETF executing a double-top pattern. Even large caps have started to execute these bearish formations. Enjoy the likely Santa Claus Rally in the very short term, but prepare for a rough new year.
Come check out the DecisionPoint Report with Erin Heim on Wednesdays and Fridays at 7:00p EST. The archives and registration links are on the Homepage under “What’s New”.
Technical Analysis is a windsock, not a crystal ball.
Happy Charting!
- Erin


