I'm asked frequently, especially now that we use the DecisionPoint Scoreboards, "What is a Neutral signal?" You'll see on the DecisionPoint Scoreboard for the S&P 500 (found in the DP Chart Gallery) that all sections are red except for the Intermediate-Term Trend Model (ITTM) which is showing a gray minus sign. That indicates that the current ITTM signal is "Neutral", neither red nor green. What does that mean though? There are two primary points that I want to make in today's blog. First, how a Neutral signal is created and second, how to invest using a Neutral signal.
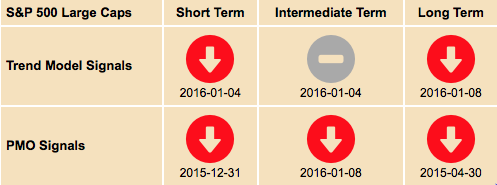
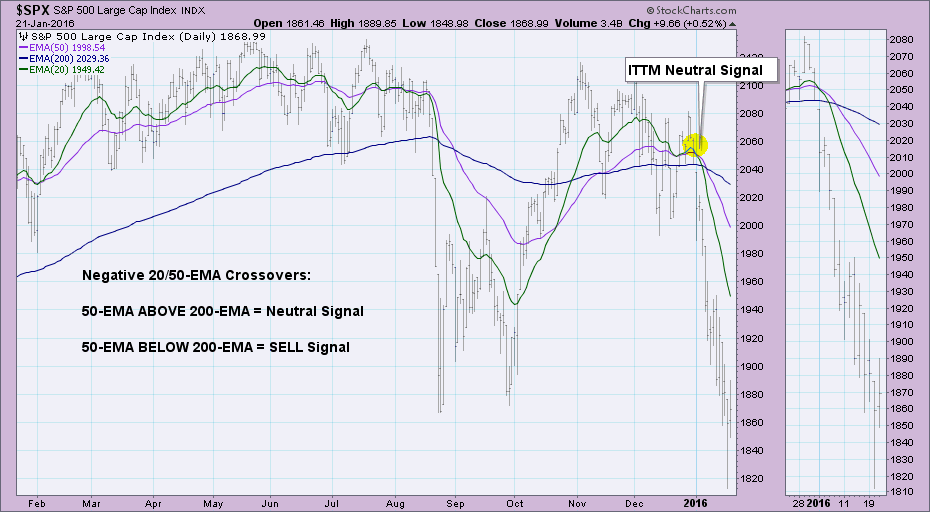
First let's look at the creation of a Neutral signal. Currently on the SPX, the 50-EMA is below the 200-EMA and has been since January 8th (you'll find the date of the signal changes in the DP Scoreboard). DecisionPoint considers any index, ETF, etc. with a 50-EMA below its 200-EMA in a "bear market". However, when the 50-EMA is ABOVE the 200-EMA, it is in a "bull market". If you get a negative 20/50-EMA crossover in a bull market, you may not want to expose yourself to the risk of a short position since the environment is bullish. But wait, look at the chart below. The Neutral signal was generated on January 4th and remember the 50/200-EMA negative crossover occurred on January 8th. Since the negative 20/50-EMA crossover occurred on January 4th, the 50-EMA was above the 200-EMA, it was determined to be a Neutral signal. Given the market environment, you might not have needed a high tolerance for risk to take advantage. We knew the 50-EMA was about to cross below the 200-EMA and only by a few days did that signal end up Neutral.
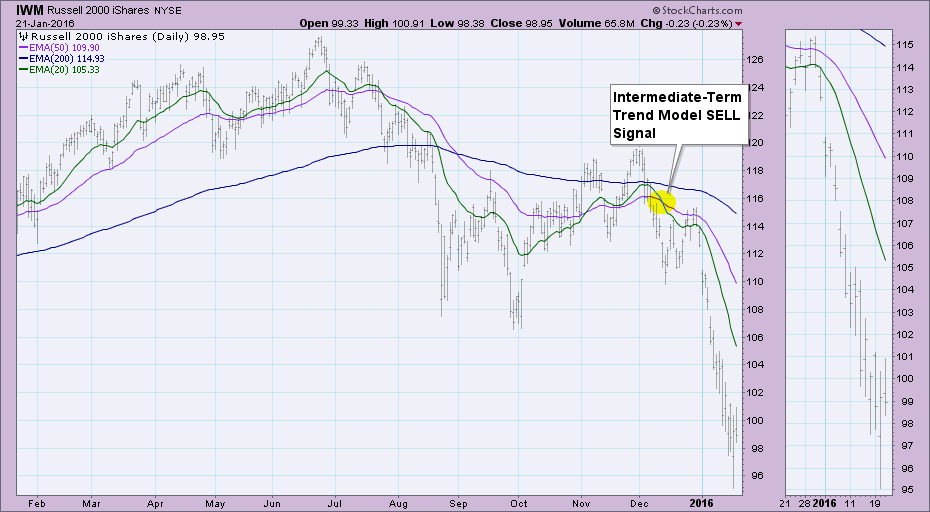
In the chart below, IWM experienced a negative 20/50-EMA crossover while the 50-EMA was below the 200-EMA. The 50/200-EMA configuration means that IWM is in a bear market. Consequently, when the 20-EMA crossed below the 50-EMA, an ITTM SELL signal was established.
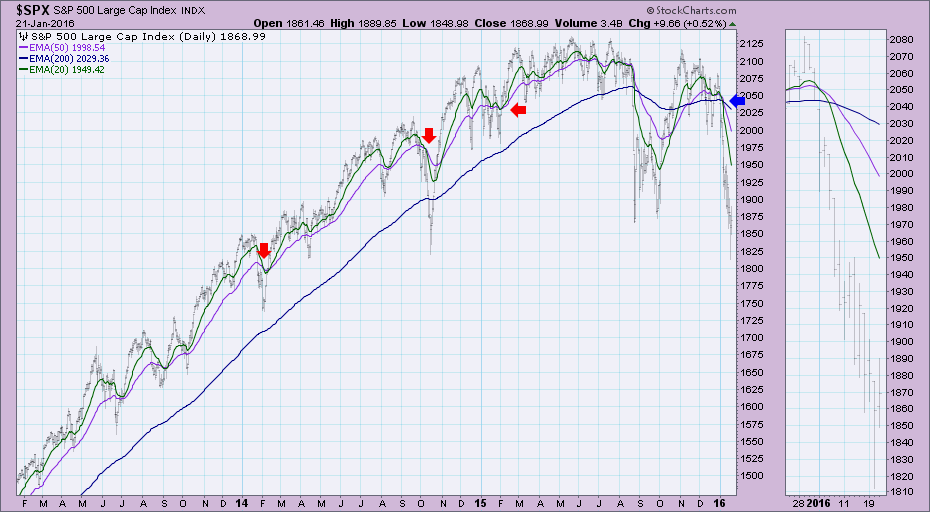
We know how these signals are created, but what should an investor do with a Neutral signal? As I alluded to earlier, it is all about risk tolerance and observation. The current Neutral signal on the SPY arrived in a very bearish environment despite the 50-EMA being above the 200-EMA, this was a good signal to do more than just cash out or hedge. Yet, notice previous Neutral signals in the chart below, the market environment was clearly bullish. Granted they came in as part of corrections, but the ultimate damage was undone by the bull market trend. The signals gave us the opportunity to pull some investments off the table or tighten stops.
Conclusion: The idea behind a Neutral signal is to keep you out of the market during downtrends, safely hedged or in cash versus shorting. If your risk tolerance level is high, you can choose to act on Neutral signals as you would a SELL signal. I didn't cover it in today's blog, but Neutral signals will also appear in the Short-Term Trend Model (STTM). The STTM uses 5/20-EMA crossovers in relation to the 50-EMA. Those signals are plentiful and will whipsaw, so caution or confirmation should be used.
Come check out the DecisionPoint Report with Erin Heim on Wednesdays and Fridays at 7:00p EST. The archives and registration links are on the Homepage under “What’s New”.
Technical Analysis is a windsock, not a crystal ball.
Happy Charting!
- Erin


