DecisionPoint with StockCharts.com offer numerous ready-to-go indicators and charts. The easiest way to observe them is by downloading the DecisionPoint Market Indicators ChartPack. One of the ChartLists that I hadn't visited in some time was the DPMI - 1300 Put/Call Ratio, particularly the 10-DMA of the Put/Call ratios. I found that chart to be very interesting given the likelihood of a bounce or at a minimum a pause.
Our intermediate-term indicators are becoming very oversold (see Carl's previous blog article). A rally or bounce is needed to decompress these conditions. The market is oversold enough to support a rally within the bear market, but is it time? The Put/Call Ratio 10-DMA will hit extremes typically at price reversals. Recall from your calculus class that when the denominator approaches infinity (bottom number gets bigger and bigger), the ratio will approach zero. So if we get far more calls than puts, the number will be less than one and get smaller as more and more calls versus puts are placed.
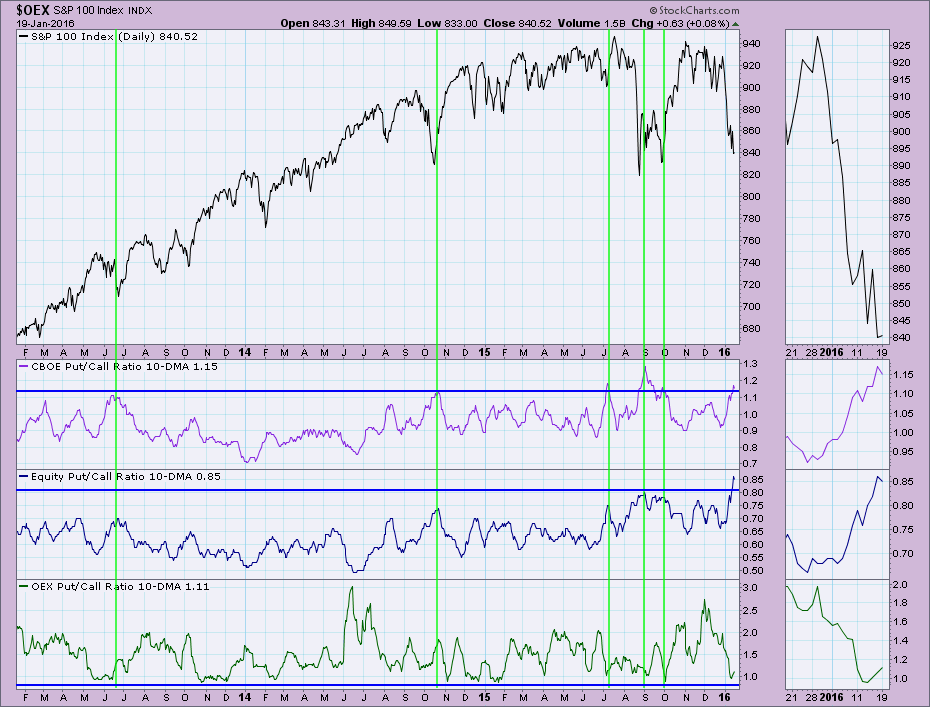
In the chart below, the CBOE and Equity put/call ratios have been getting higher, meaning sentiment among investors bearish. The OEX put/call ratio is generally above 1 because these puts and calls are generally used for hedging by big players, so there will almost always be more puts than calls. The OEX put/call ratio has been declining. Remember the ratio will decline as more calls and fewer puts are bought. This means that big money has been lowering hedges in preparation for a bottom. Equity ratios tend to have lower values in comparison as they are generally made by smaller investors using options to supplement investment income rather than hedges.
I think the chart below speaks for itself. I've annotated when we've seen similar extended readings and they correlate to price bottoms. CBOE has a value over one, meaning there are more puts than calls, and is rising into very overbought territory. When CBOE and Equity put/call ratios get very overbought, it is time for a price bottom. OEX put/call ratios have been steadily declining and are now very oversold which is bullish.
Conclusion: Within the major or longer-term downtrend/bear market, we will see plenty of starts and stops along the way. A rally will occur when oversold conditions are too extreme in a bull market. In a bear market, the results are not very consistent, so confirmation is important. Looking at the 10-DMA of the put/call ratios for the CBOE, Equities and OEX, readings are have hit extremes and would suggest the market will be serving up a bounce or rally before resuming the bear market trend.


