 Green means "go", right? Well in terms of the DecisionPoint Scoreboards, not necessarily. The DecisionPoint Scoreboards act as a "finger in the wind" or as we like to say, "windsock", to see which direction and speed markets are moving in right now. It's a temperature gauge.
Today, there were three bullish signal changes on our DecisionPoint Scoreboards. New Short-Term Trend Model BUY "signals" appeared for the S&P 100, S&P 500 and the Dow Industrials. The Nasdaq 100 which has been outperformed by all three of these indexes in the last three months, remains on a Neutral "signal". I am putting "signal" in quotes because as far as the Short-Term Trend Model is concerned, I don't regard its crossovers as "timing" signals. The Short-Term Trend Model identifies established short-term trends, but doesn't necessarily mean it is a good entry point. Note on the Boards below that the Price Momentum Oscillator (PMO) BUY signals arrived earlier, identifying established positive momentum.
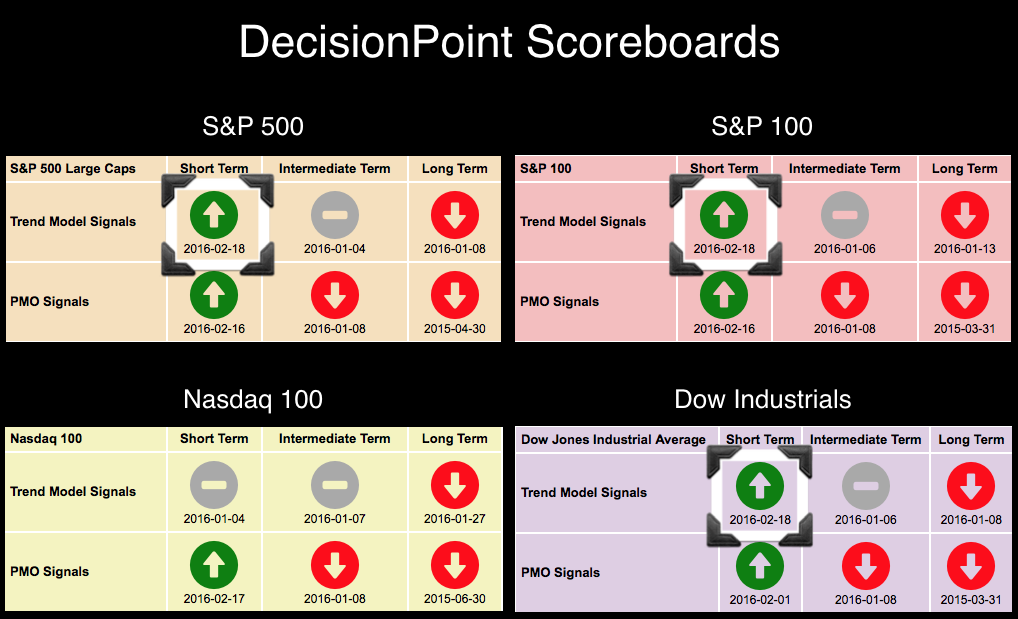
The key word here is "established". If we were in a bull market, the Long-Term Trend Model would be on a BUY signal, and that would shift our regard for these new green arrows. In a bear market, they tell us that a short-term rally is in force but not necessarily that a new bull market rally is on its way.
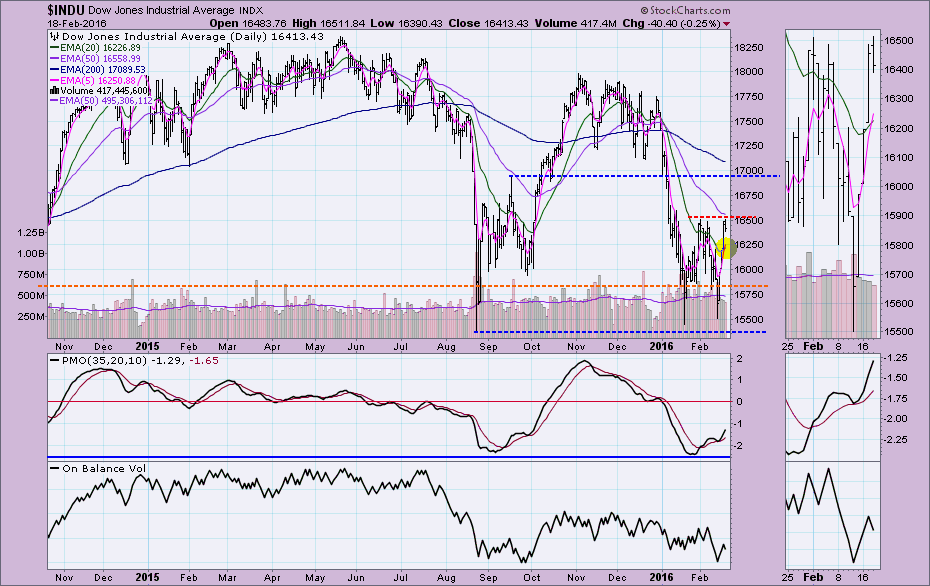
The daily charts for these four indexes show us that despite new Short-Term PMO and Trend Model BUY signals, price is being stopped at overhead resistance.
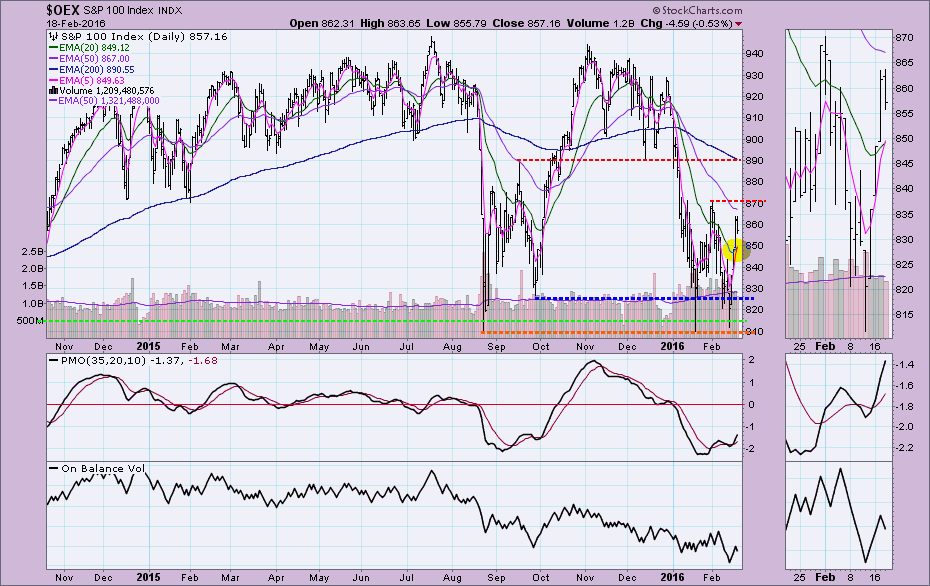
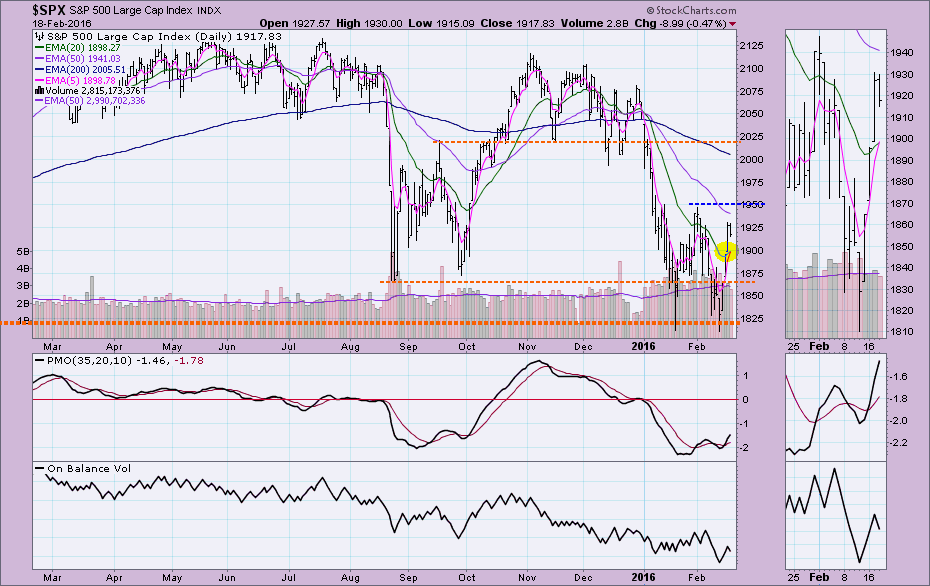
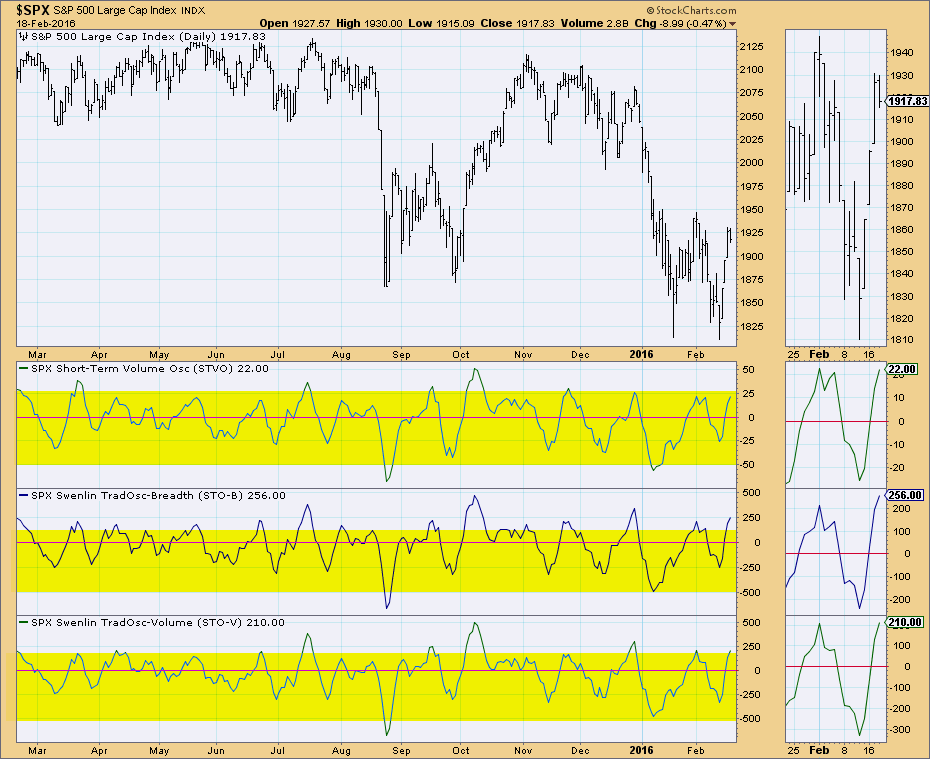
These signals could be telling us to expect a breakout and possible completion of the double-bottoms on these indexes; however, a quick look at the DP short-term indicators chart for the S&P 500 below, shows that price is short-term overbought and we should expect a price top, not a major rally.
Conclusion: In a bear market we need to better evaluate the meaning of short-term BUY signals on the DecisionPoint Scoreboards by reviewing short-term indicators and of course, the charts. The green on the current DecisionPoint Scoreboards tells me that a rally was established. In a bull market it could be a good time to enter. In a bear market, we should temper bullish expectations. So while we could see more rally and a breakout, I wouldn't expect the beginning of a new bull market or a rally to all-time highs. If we begin to see intermediate-term BUY signals, then we can begin to increase our bullish expectations. Come to tomorrow's DecisionPoint Report webinar where I'll review these charts as well as all of the weekly charts that have gone final. You can register for free webinars here or check out the recordings.
Come check out the DecisionPoint Report with Erin Heim on Wednesdays and Fridays at 7:00p EST, a fast-paced 30-minute review of the current markets mid-week and week-end. The archives and registration links are on the Homepage under “What’s New”.
Technical Analysis is a windsock, not a crystal ball.
Happy Charting!
- Erin


