 With the market overbought and ready for at least a pullback, I decided to run one of my bear market Price Momentum Oscillator (PMO) scans to see if I could find a few "dogs" out there. The scan produced a handful for review but the two below stood out to me. They are in the Healthcare/Pharm industries which is the last sector on the DecisionPoint Market/Sector Summary with Neutral signals.
Here is the scan that I performed:
[group is SP500]
AND[today's PMO Line(35,20,10) > today's PMO Signal(35,20,10)]
AND [today's PMO Line(35,20,10) < yesterday's PMO Line(35,20,10)]
AND [yesterday's PMO Line(35,20,10) < 2 days ago PMO Line(35,20,10)]
AND [today's ema(20,close) < today's ema(50,close)]
AND [today's ema(50,close) < today's ema(200,close)]
Reducing it to plain language, I scanned for S&P 500 stocks that have a PMO that has topped and has been in decline for three days but hasn't had a negative crossover the signal line. Additionally, the Trend Model configuration is as negative as possible with the 200-EMA > 50-EMA > 20-EMA. Of the eight results, here are two charts I found interesting:
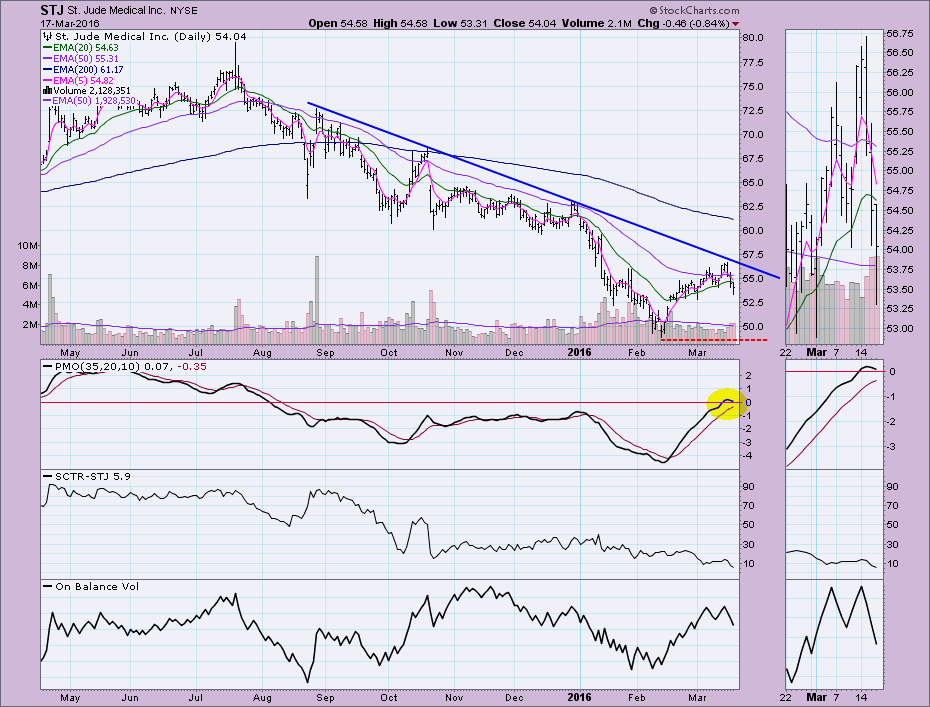
St. Jude Medical's (STJ) PMO just topped above the zero line and is headed for a negative crossover. Price has been continually stopped at the declining tops trendline. A test of support at the February low is highly likely. If you want extra confirmation, you could wait for the actual negative crossover and a Short-Term Trend Model SELL signal that would generate if the 5-EMA had a negative crossover the 20-EMA. The SCTR is abysmal and volume has been behind the decline.
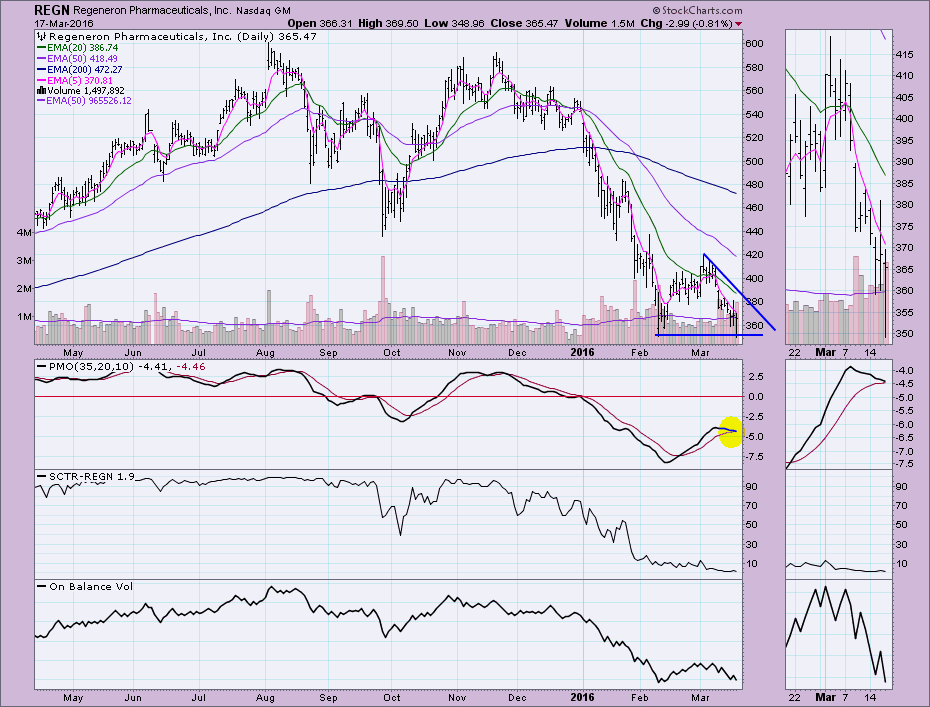
REGN may have had a successful test of support today, but the PMO top below the zero line and pending negative PMO crossover are compelling. The Short-Term Trend Model triggered a SELL signal after a whipsaw BUY earlier this month. Even the chart pattern, a descending triangle, is bearish.
Conclusion: PMO scans are helpful not only in bull markets, but they can also help you screen for dogs in a bear market.
(And, yes, the dog on the left is my "Leo" and my daughter's "Paris" is on the right. I couldn't resist the "screen" and "dogs" allusion.)
Come check out the DecisionPoint Report with Erin Heim on Wednesdays and Fridays at 7:00p EST, a fast-paced 30-minute review of the current markets mid-week and week-end. The archives and registration links are on the Homepage under “What’s New”.
Technical Analysis is a windsock, not a crystal ball.
Happy Charting!
- Erin


