While watching the fourth season of House of Cards I have been reminded of the 50-50-90 rule: Anytime you have a 50-50 chance of getting something right, there's a 90% probability you'll get it wrong. House of Cards is a Netflix series depicting political intrigue and mayhem in Washington, D.C. Season four is set in the 2016 election season, which is a bit tedious, considering all the real political stuff we watch in our home. An amusing (to me) back story this season is that oil prices are through the roof, and we see a replay of the 1970's gas shortage. It is amusing because in real life oil has recently been down at 12-year lows, and gasoline prices have been fabulously low.
I don't think the writers were trying to predict the oil market, but they probably assumed that prices would remain where they were when the script was being written, around $100/barrel, and the prospect of much higher prices wouldn't be so far-fetched. Again, I realize that it is fiction, but it is so hilariously wrong.
But, hey, TV writers can't be expected to do any better than those of us who are in the business of market analysis, and I am pretty certain that in mid-2014 there were very few people (and I wasn't one of them) who thought oil prices would be where they are today. The following chart shows that the oil market has delivered a lot of extreme surprises in the last 12 years.
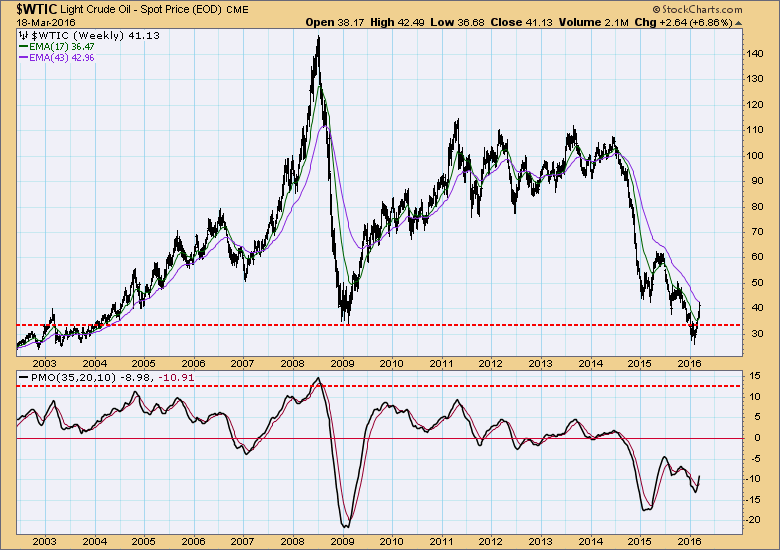 Another thing the chart reveals is that prices are rallying off the low, and that recently violated support has been recaptured.
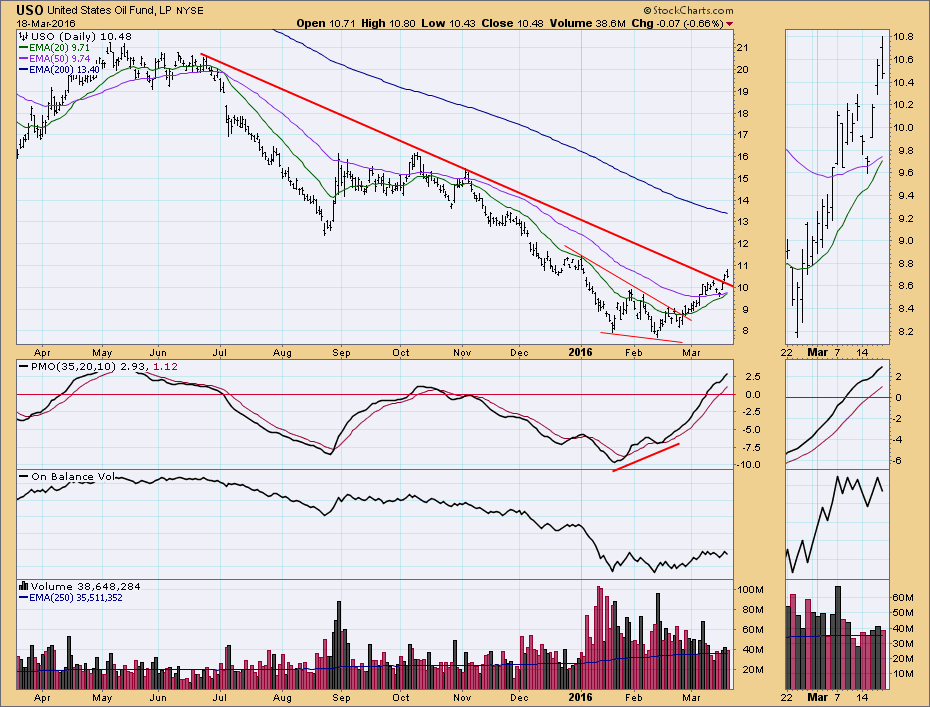
Getting back to the real world present, let's look at a daily chart of USO. The January/February double bottom was pared with a PMO positive divergence. Also, we can see the expected bullish resolution of a falling wedge formation. This week price broke above a longer-term rising wedge pattern, and next week there is a good chance that the 20EMA will cross up through the 50EMA, generating an IT Trend Model BUY signal. A good bullish picture, except that the OBV does not confirm the recent breakout.
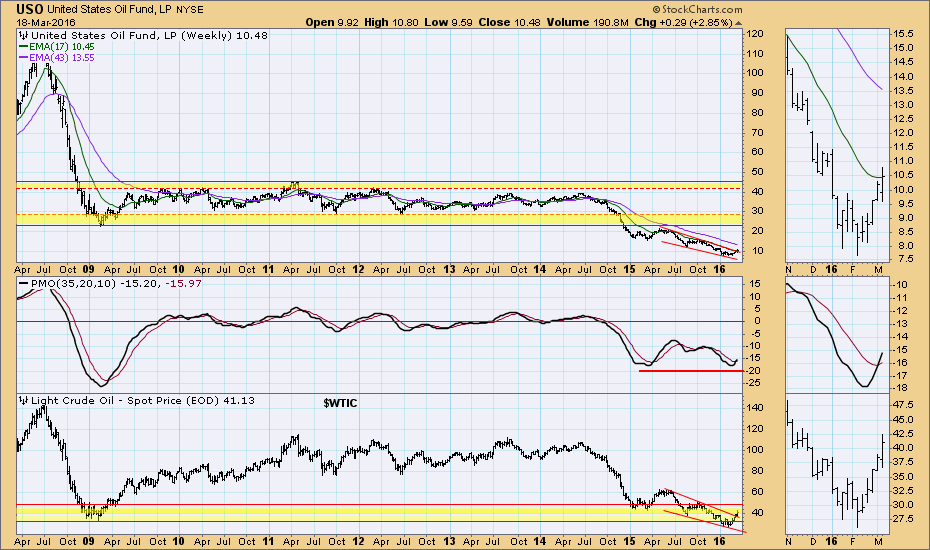
 The broader context of the weekly chart also looks bullish. There is a weekly PMO BUY signal, and a PMO positive divergence. $WTIC has moved back up into the support/resistance zone, and $WTIC has broken out of a falling wedge. I don't know if a return to $100/barrel is in the cards, but I think that the decline probably over.
 SUMMARY: While high oil prices provide a useful stressor for House of Cards scripts, it is real life that really requires suspension of disbelief because of crashing oil prices since the 2014 top. At this point it seems likely that prices have put in a long-term low and may continue higher. I will consider the 2015 high to be a probable longer-term resistance level.
Technical analysis is a windsock, not a crystal ball.


