Welcome to Part II of Thrust/Trend Model (T/TM) education. In Part I, I discussed how the Intermediate-Term Trend Model (ITTM) and Long-Term Trend Model (LTTM) generate BUY/SELL and Neutral signals. The ITTM and LTTM make up the "Trend component" of the Thrust/Trend Model. The second component of the T/TM is "thrust". Thrust measures momentum and internal strength using two DecisionPoint indicators, the Price Momentum Oscillator (PMO) and the Percent Buy Index (PBI). Each creates their own BUY and SELL signals. Combined, these signals determine the overall timing signal for the Thrust component.
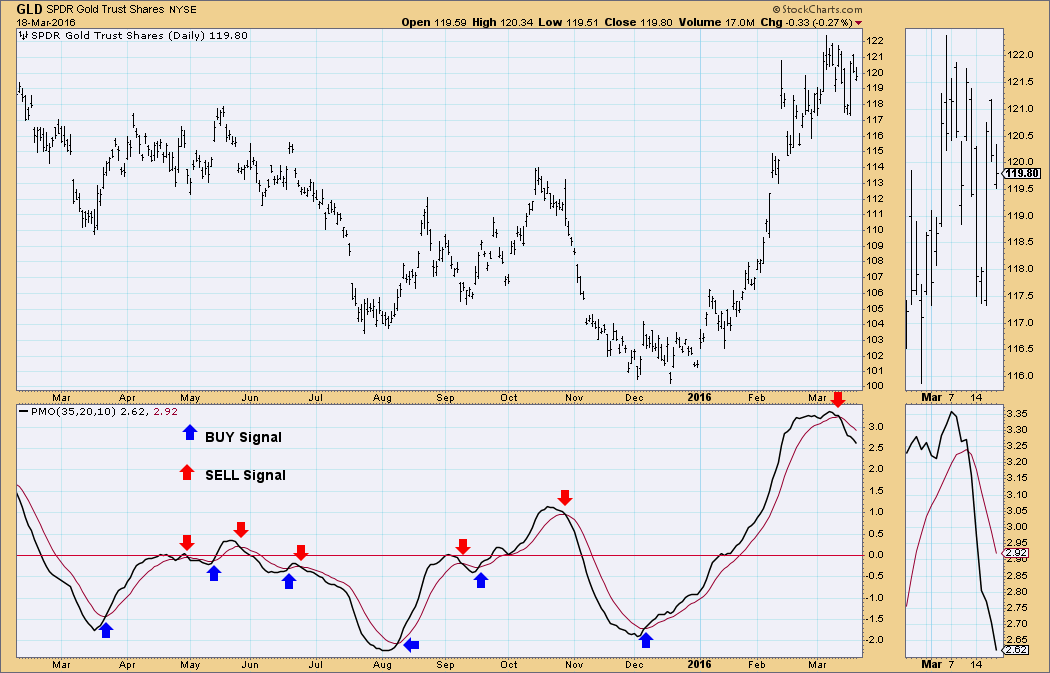
Price Momentum Oscillator (PMO): There is an extensive article in ChartSchool on how the PMO is calculated and used so I won't go into detail regarding the creation of the PMO. However, it is important to understand what is being measured and how PMO BUY and SELL signals are generated.
As the name implies, the PMO measures momentum based on price. The PMO is an oscillator based on a Rate of Change (ROC) calculation that is smoothed twice with exponential moving averages that use a custom smoothing process. (Again, you can find the formula and explanations in ChartSchool).
When the PMO is rising, momentum is positive. When it is declining, momentum is negative. A BUY signal is generated when the PMO crosses above its 10-EMA and a SELL signal is generated when the PMO crosses below its signal line (10-EMA).
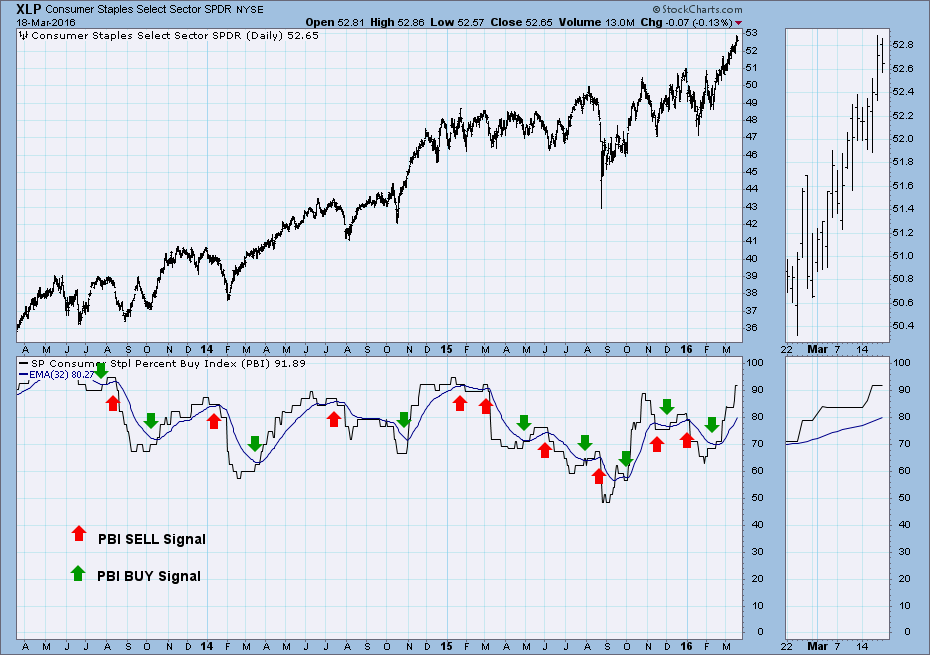
Percent Buy Index (PBI): In order to understand the PBI, you need to review the Price Momentum Model (PMM). The PMM generates BUY and SELL signals for individual stocks/ETFs/Funds etc. You can read about how these signals are triggered in the ChartSchool article on the PMM. This model is based solely on price, but it has nothing to do with how the PMO is calculated.
The PBI is an indicator that can ONLY be used on an index, sector or other vehicle made up of a group of component stocks or funds. For example, the PBI can be calculated for the S&P 500, but not for an individual stock within the S&P 500. Here's why: The PBI is a percentage based indicator. You calculate the number of stocks or components within the index or group that are on PMM BUY signals. So if the PBI is 75, that means that 75% of the group in question are on PMM BUY signals. The PBI also uses a signal line that is the 32-EMA of its readings.
Thrust Component: The PMO and PBI make up the Thrust component of the T/TM. Their signals are combined to determine the signal for Thrust. If both the PMO and PBI are above their signal lines. Because we only use BUY signals on the Thrust component to determine the signal for the T/TM, we do not define signals for divergence or negative convergences of the PMO and PBI. So the Thrust component is either on a BUY signal or it is not.
Next week I'll conclude the discussion in Part III on the Thrust/Trend Model by defining how signals are generated on the Thrust/Trend Model using both the Thrust component and Trend Model component together.
Come check out the DecisionPoint Report with Erin Heim on Wednesdays and Fridays at 7:00p EST, a fast-paced 30-minute review of the current markets mid-week and week-end. The archives and registration links are on the Homepage under “What’s New”.
Technical Analysis is a windsock, not a crystal ball.
Happy Charting!
- Erin


