The preliminary S&P 500 Index 2015 fourth quarter earnings results are in, and it is once again time to look at our earnings chart, which shows the S&P 500 in relation to its normal value range. (Note: The chart is a static graphic, not an active chart.)
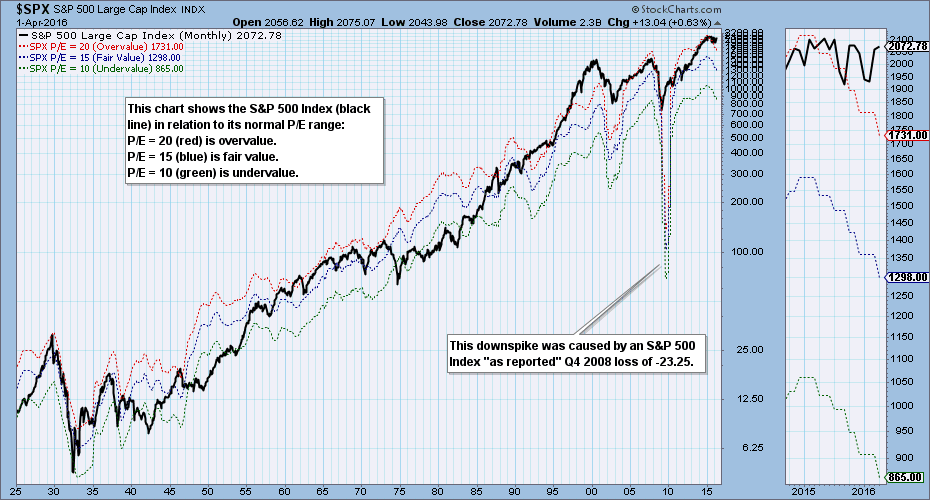
The bands on this chart show where the S&P 500 would be if it had an undervalued P/E of 10 (green), a fair valued P/E of 15 (blue), or an overvalued P/E of 20 (red). While the bands don't rigidly contain the range of the Index, they do help us get a quick assessment of the current valuation along with some historical perspective. The current P/E is 24, which places the Index well above the normal overvalue level of 20. Last quarter the P/E was 23, so the situation is getting worse. To clarify, the S&P 500 is at 2073, which is 17% higher than the overvalue level of 1731.
As a general rule a P/E range of 10 to 20 should be considered normal, particularly for a broad market index like the S&P 500. (The percentage of earnings for a 20 P/E is 5%; for a P/E of 10 it is 10%.) When those limits are exceeded, it is a good idea to find out why. In the case of the S&P 500, earnings have been trending down since the beginning of 2015, which is a more serious than rising prices just getting ahead of rising earnings.
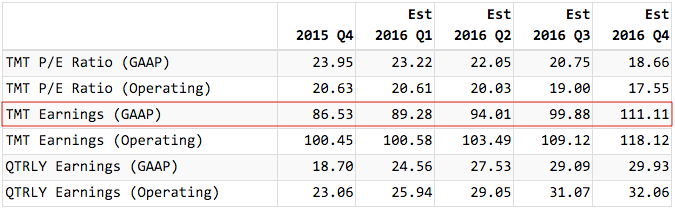
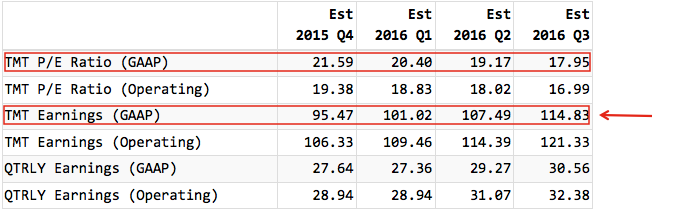
In the table below twelve month trailing (TMT) earnings are projected to increase over the next four quarters, which in turn will cause the P/E to drop (if the index value stays the same); however, we cannot be sure that estimates will be realized. The second table shows what the estimates were three months ago. Note how much they have dropped since then.
 Source: standardandpoors.com
CONCLUSION: With the S&P 500 Index being higher than its normal P/E range, and with earnings trending down, the fundamentals are working to pull prices downward. Earnings are projected to improve over the next twelve months, but what are those estimates worth? The previous quarter's estimates proved to be pie in the sky. For now, what we do know is that the S&P 500 is overvalued and earnings continue to trend downward. That has negative implications for future stock prices.
Technical analysis is a windsock, not a crystal ball.
