I suspect a few eyebrows were raised when they saw the title to my DecisionPoint Alert blog article today, "Fierce Overhead Resistance Looming". Resistance lines, support lines and trend lines are usually considered stronger based on how many times price "touches" them. Intuitively this makes sense. If price forms support at a intermediate-term low and then rallies, when it begins to fall again, buyers begin lining up to purchase at that low so they can catch the next rally. Each time price falls to that level and buyers pick price back up, it forms an even stronger support line. The opposite is also true with resistance. Additionally, you can sometimes merge support and resistance lines when they occur at the same price level.
Here are three charts that I looked at today in the DecisionPoint Alert blog that I want to share in the free DecisionPoint blog. All three of these charts show strong overhead resistance based on the various "touches". There are many!
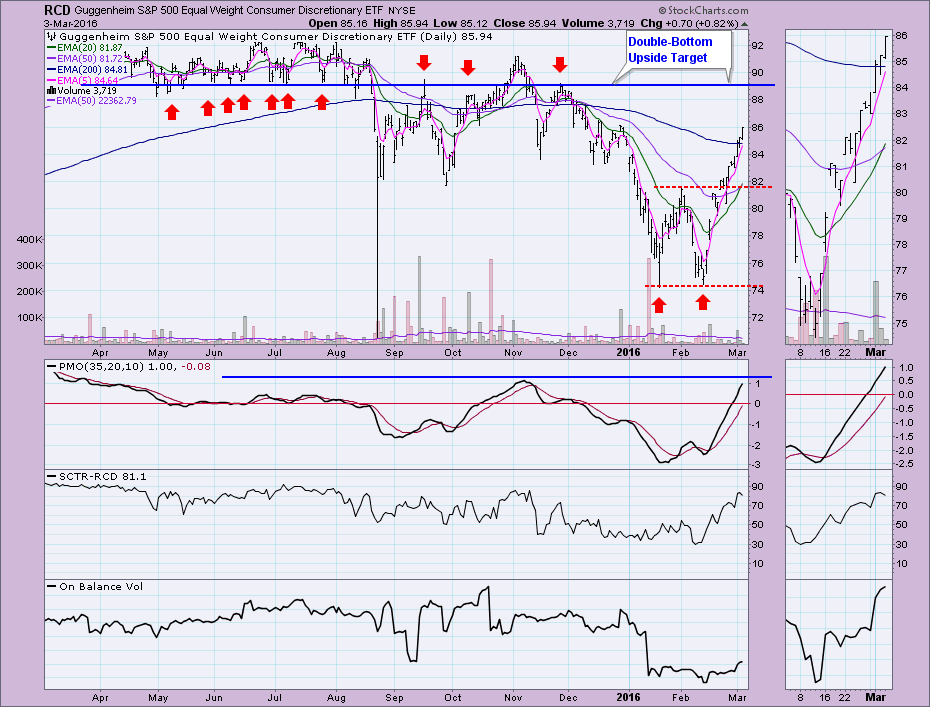
In the case of the equal-weight Consumer Discretionary ETF, RCD, there is a double-bottom pattern that executed. The upside target is right on that resistance line. Not to mention the Price Momentum Oscillator (PMO) is short-term overbought.
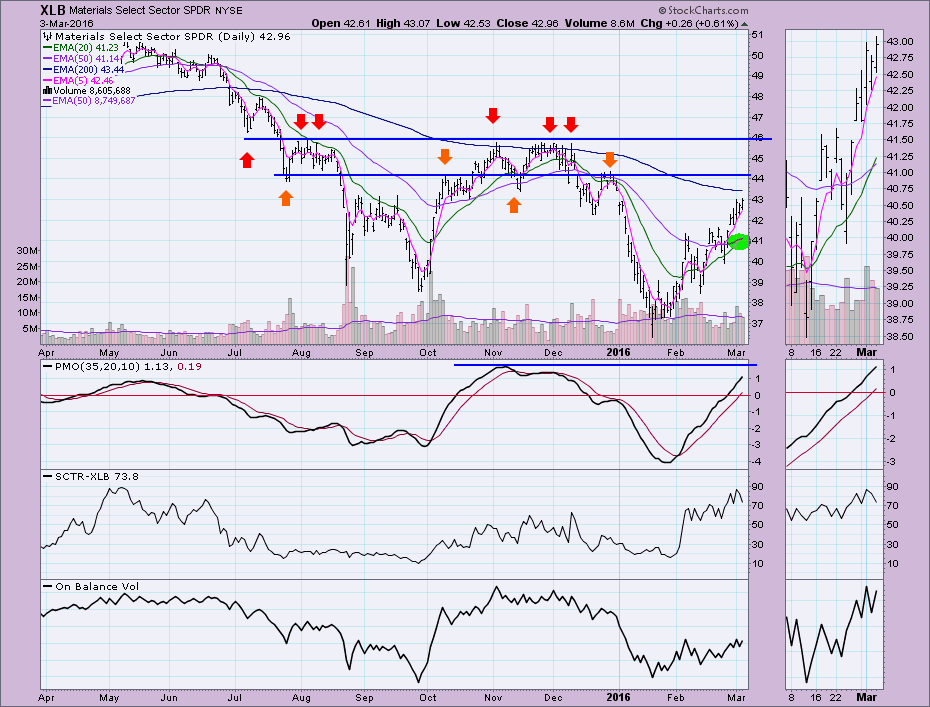
XLB has two areas of strong overhead resistance to overcome and its PMO is very overbought.
The SPY has just about hit overhead resistance; a resistance line that has many "touches". The PMO is not overbought; it is neutral. However we can see that within the last year, "overbought" doesn't require a move to the very top of the PMO range.
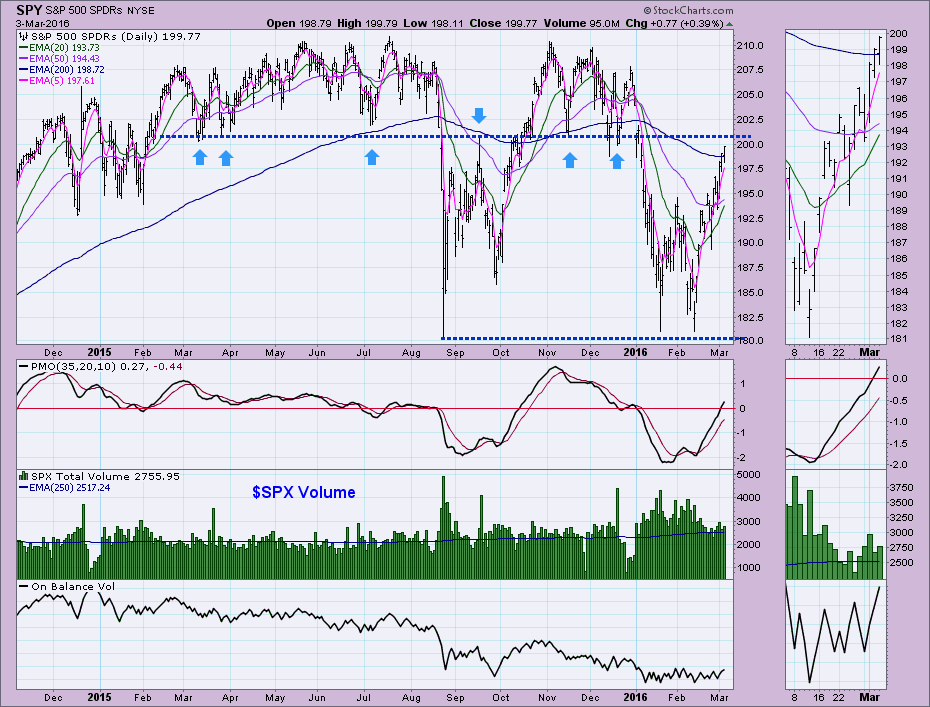
Conclusion: Given the extremely overbought indicators in all three time frames (you'll find these charts in the DecisionPoint Alert blog), it should be extraordinarily difficult to break above annotated areas of resistance. On the bright side, the Intermediate-Term Trend Model executed BUY signals (20/50-EMA positive crossovers) on RCD and XLB. The SPY is nearing one so it isn't out of the realm of possibility that a test of all-time highs is possible.
Come check out the DecisionPoint Report with Erin Heim on Wednesdays and Fridays at 7:00p EST, a fast-paced 30-minute review of the current markets mid-week and week-end. The archives and registration links are on the Homepage under “What’s New”.
Technical Analysis is a windsock, not a crystal ball.
Happy Charting!
- Erin


