The DecisionPoint Chart Galleries include not only the S&P 500, but for members, there are also the Nasdaq 100, S&P 100 and Dow Industrials Chart Galleries. Finding the Chart Galleries is easy, you'll find a link in the center line of the home page or in the righthand side navigation list. The Galleries not only include price charts in three time frames, but you also get an array of DecisionPoint "greatest hits" indicators. If you join me for the DecisionPoint Report webinars, you'll get to see me review the important charts from the Galleries or members can read the DecisionPoint Alert where I analyze these charts daily and help you to understand how to read them yourself.
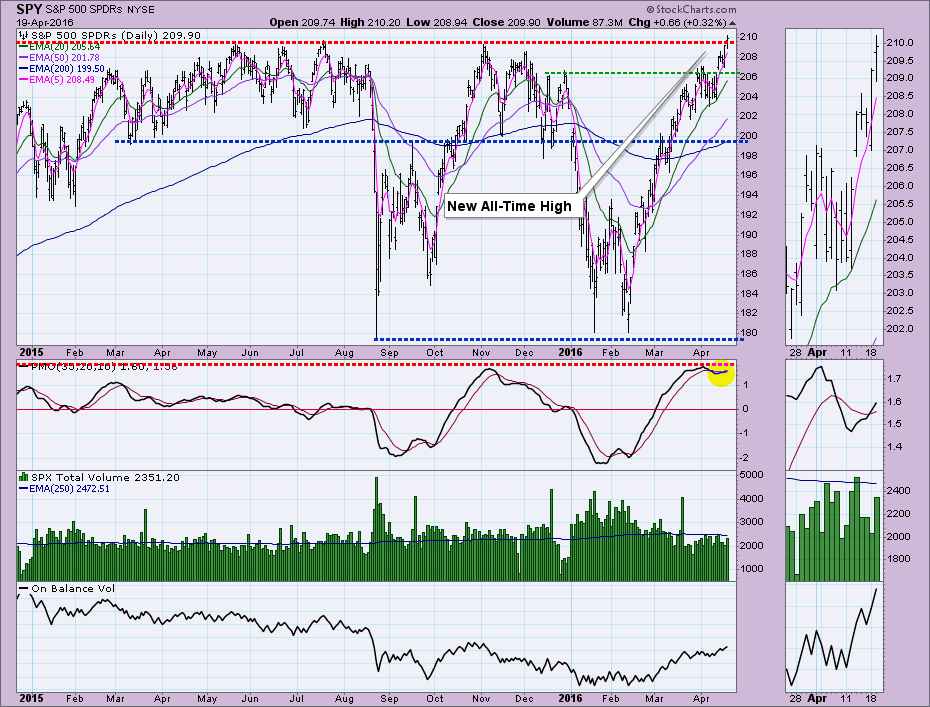
The SPY made a new all-time high today which I reviewed in detail in the DecisionPoint Alert blog today. The SPY chart shows the breakout but it also shows a Price Momentum Oscillator (PMO) at the top of its range. Despite a new BUY signal, we need to temper expectations given the PMO doesn't have much more room to move higher.
On the flip side, I think it is important to look at the actual indexes from the DP Chart Gallery, a few have some distance to cover before testing overhead resistance at the all-time highs.
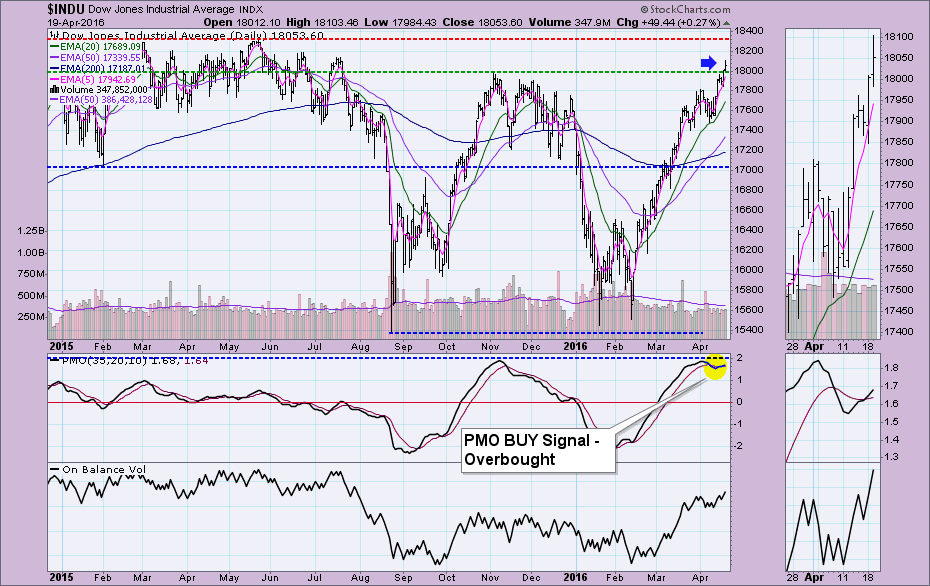
The Dow only has a only few points to make up to set all-time highs. Shorter-term resistance was broken today. Unfortunately yesterday's PMO BUY signal arrived in very overbought territory. I would expect some sort of pullback before all-time highs are actually set.
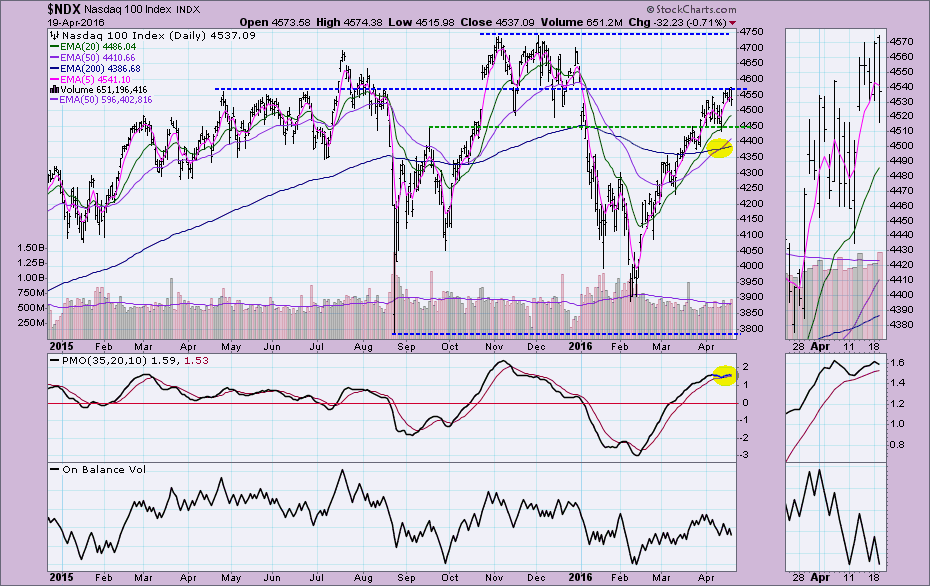
Nasdaq 100 is more than a few percentage points away from all-time highs. Unlike the Dow, shorter-term resistance has foiled the NDX. Unlike the other indexes, the NDX was able to hold onto its February BUY signal which suggests some internal strength. However, the struggle at intermediate resistance, a PMO that is at the top of the range, and a declining OBV line leave me pessimistic.
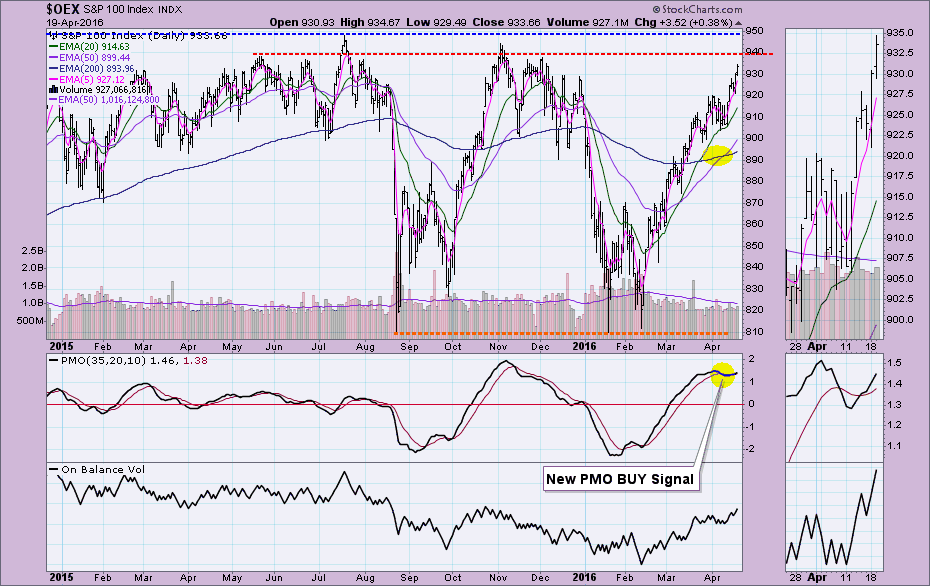
The OEX, like the Dow, is very near it's all-time highs; however, there is intermediate resistance at the May/June 2015 and December high that has to be hurdled. The PMO is overbought which is bearish, yet it combines with a bullish PMO BUY signal. The OBV line for the OEX has been moving mostly sideways but has picked up on this late-month rally which is somewhat bullish.
The recent PMO BUY signal would normally inspire optimism on the SPX, but as I noted above, a very overbought PMO is dangerous despite a BUY signal. The most recent overbought reading in November 2015 should be warning. A price pullback is called for.
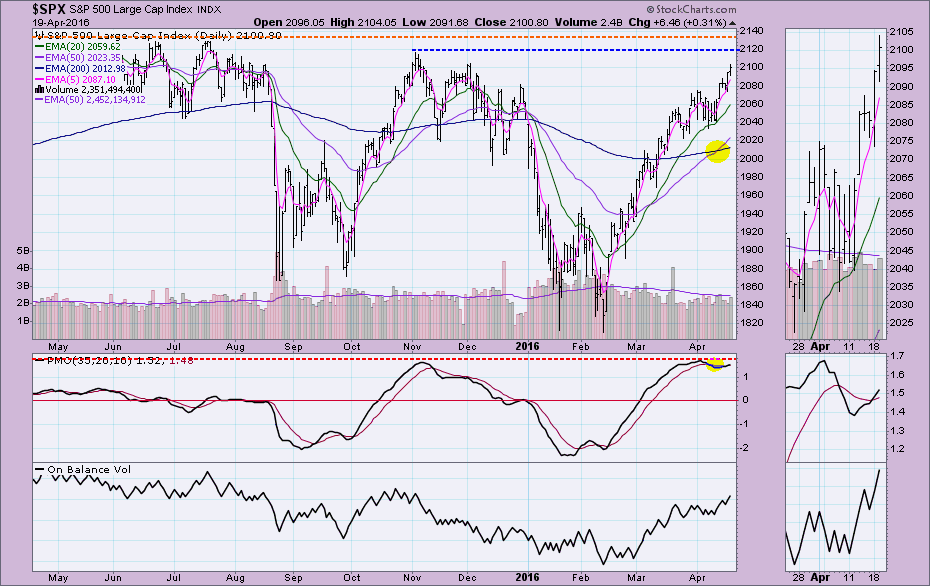
Conclusion: It is not out of the realm of possibility that all of these indexes will make all-time highs. A pullback that would drop the PMOs from overbought extremes would better set the table.
Come check out the DecisionPoint Report with Erin Heim on Wednesdays and Fridays at 7:00p EST, a fast-paced 30-minute review of the current markets mid-week and week-end. The archives and registration links are on the Homepage under “What’s New”.
Technical Analysis is a windsock, not a crystal ball.
Happy Charting!
- Erin


