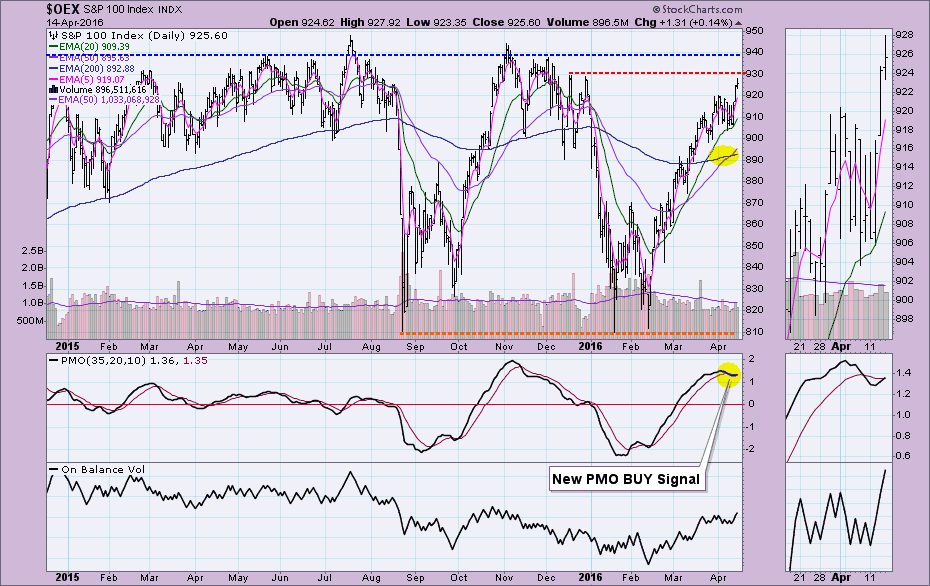
 The Price Momentum Oscillator (PMO) is an excellent gauge of internal strength and of course, as the name implies, momentum. So a new PMO BUY signal should excite and motivate, right? Not quite. Looking at the daily chart and even better, the monthly chart will give you true long-term perspective.
Looking at the daily chart for the OEX, you'll see the annotated PMO BUY signal. There are problems with this signal at the start, the PMO is resting at the top of its range. Signals that arrive in overbought territory will generally not pan out. However, we can't fully dismiss it given the very positive configuration of the Trend Models (5-EMA > 20-EMA > 50-EMA > 200-EMA), especially the recent 50/200-EMA positive crossover which essentially moved the OEX into a "bull market".
Price is now entering an area of strong overhead resistance at the all-time highs. The set-up is extraordinarily similar to the November top. Price skipped around after, but ultimately was unable to breakout.
If are talking about the possibility of a breakout above all-time highs and entering a new bull market, I believe it is important for us to look at the monthly chart to determine whether the market is conducive.
Long-term momentum is negative as the PMO is in decline. It does appear to be decelerating, but the rounded top price pattern is a very bearish configuration. In addition, the PMO has plenty of room to move lower. Note that the LT PMO is quite successful at cluing us in on the shifts from a bull market to a bear market and vice-versa. The monthly chart suggests there is more downside, not a burst to new all-time highs.
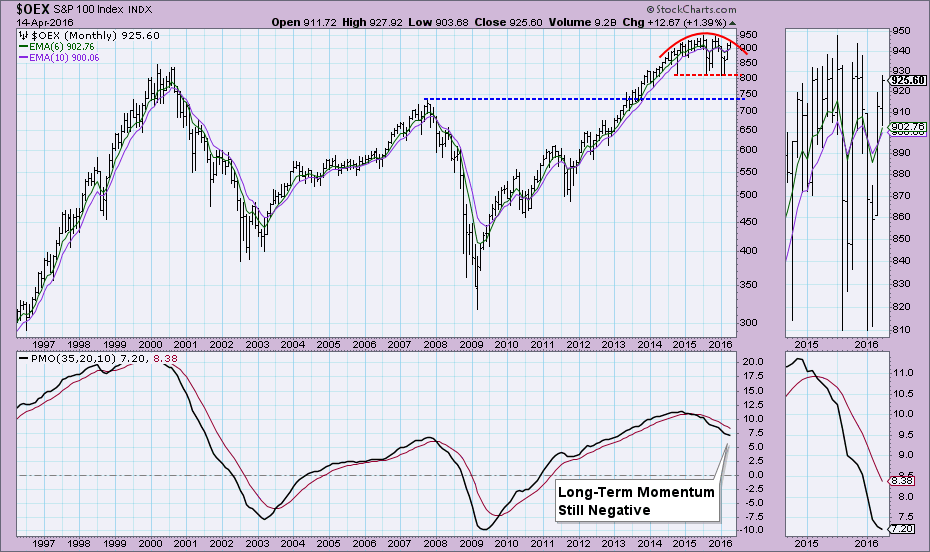 Conclusion: The short-term PMO BUY signal on the OEX likely will not pan out. It is certainly plausible that all-time highs could be broken and a new bull market is on tap, but longer-term bearish forces are at work. The long-term PMO is falling and is neutral at best; it needs to unwind further. The long-term rounded top does not inspire confidence either.
Come check out the DecisionPoint Report with Erin Heim on Wednesdays and Fridays at 7:00p EST, a fast-paced 30-minute review of the current markets mid-week and week-end. The archives and registration links are on the Homepage under “What’s New”.
Technical Analysis is a windsock, not a crystal ball.
Happy Charting!
- Erin


