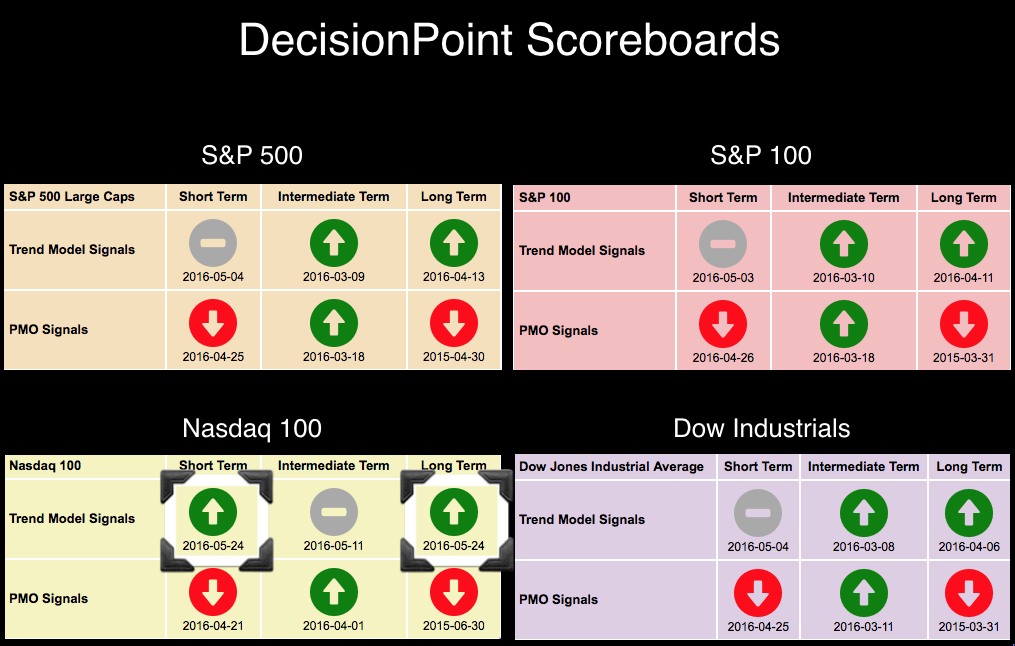
The Nasdaq 100 (NDX) has been very weak in comparison to most of the large cap indexes; however, it was reinvigorated with today's rally. You'll note on the DecisionPoint Scoreboard Summary below a highlight of the new BUY signals for the NDX. One important point to note is that the NDX is the first of the four indexes to garner a Short-Term Trend Model (STTM) BUY signal. Yesterday, saw a new Long-Term Trend Model (LTTM) SELL signal, but it was short-lived when the 50-EMA crossed back above the 200-EMA, restoring the BUY signal. If we see some follow-through on today's rally, the Intermediate-Term Trend Model (ITTM) Neutral signal on the NDX will move to a green BUY signal.

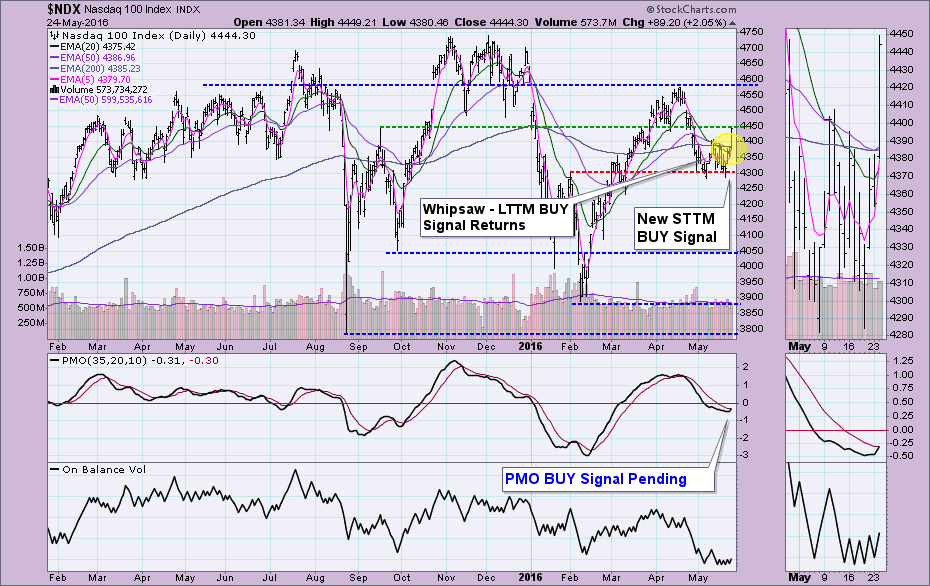
The daily chart reveals not only the 5-EMA positive crossover the 20-EMA (STTM BUY signal) and the 50-EMA positive crossover the 200-EMA (LTTM BUY signal), but it also shows a Price Momentum Oscillator (PMO) that decelerated and bottomed. The PMO is only one one-thousandth of a point away from a BUY signal. Barring a tremendous decline, the crossover BUY signal will appear on the NDX Scoreboard tomorrow. This would essentially move the NDX into the strongest positive Scoreboard among the four indexes covered.
Price technically was stopped at overhead resistance at the September 2015 top, but the imminent PMO BUY signal suggests it will breakout. Another bullish characteristic of this chart is the breakout from the area of consolidation the NDX has been traveling within; in fact, you could make a case for a reverse flag formation. While it is a bearish pattern, this breakout caused a bullish execution of this bearish pattern which is very positive. I didn't annotate it, but there is a short-term double-bottom (visible in the thumbnail) that was technically executed today. I think a test of overhead resistance at 4575 is plausible.
Conclusion: The bullish breakout on the NDX lit up its Scoreboard with two new BUY signals. The third, a PMO positive crossover BUY signal, will be added tomorrow. For reference, the OEX, SPX and Dow are nearing Short-Term Trend Model BUY signals (5-EMA/20-EMA positive crossovers) and we should see those appear on the Scoreboards by the end of the week, if not sooner.
Come check out the DecisionPoint Report with Erin Heim on Wednesdays and Fridays at 7:00p EST, a fast-paced 30-minute review of the current markets mid-week and week-end. The archives and registration links are on the Homepage under “What’s New”.
Technical Analysis is a windsock, not a crystal ball.
Happy Charting!
- Erin


