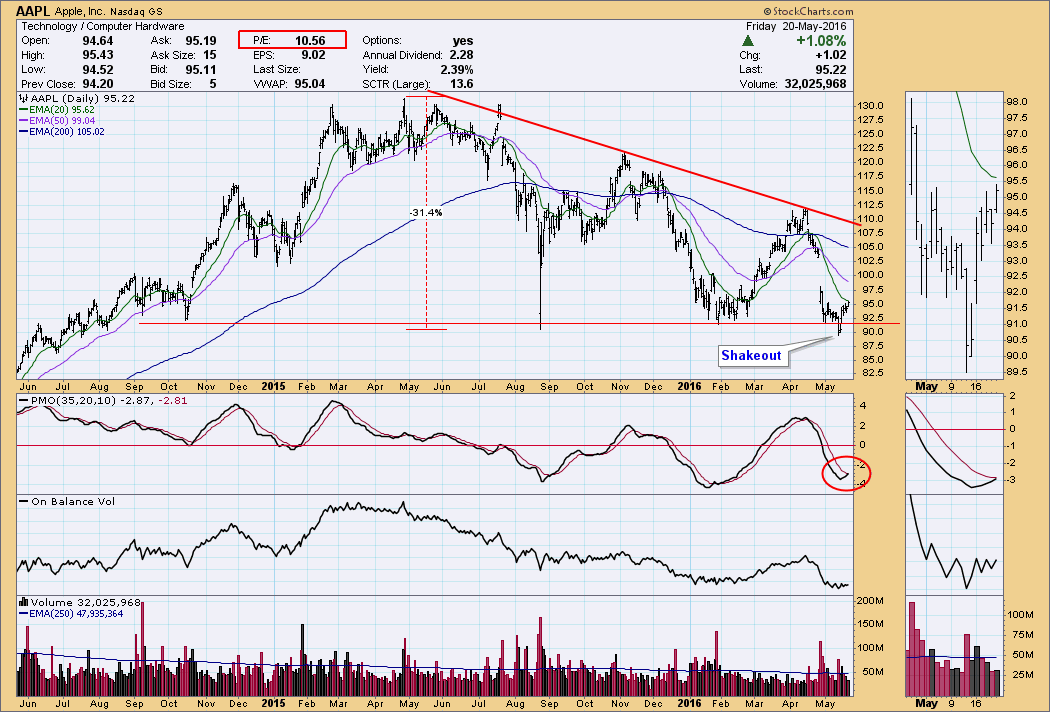
I don't spend much time with TV business news channels, but I do use them as company when I'm getting up in the morning. Several days ago there was a headline that Apple (AAPL) was down -14% this year, providing a perfect example of how business media often miss the point. It would have been more helpful if the headline had informed us that Apple was down -31% from its all-time high. At any rate I was prompted to check out the AAPL chart, and I found some evidence that the stock may be forming an important bottom. To be sure, most of the evidence is bearish, but there are signs that should pique our interest in the very short term.
To begin, the PMO has bottomed and is close to crossing up through its signal line. After a smooth decline the PMO bottom has occurred at the oversold side of its range, and the bottom is decisive, not tentative. This is one of the first technical signs that should attract our attention.
Another feature is the shakeout that took place the week before last. Price broke below the support line drawn across the January low. This is just the kind of event that causes people to finally give up and dump their shares. As it turned out, price quickly reversed back above support and provided us with an indication that we could be looking at an important bottom.
Fundamentally, AAPL has a P/E of 10.56, which is at the low end of the normal P/E range (10 to 20), and it is unusually low for a tech stock.
One negative issue is that OBV has not confirmed last week's price advance, failing to make a series of new OBV highs that match new price highs.
All the longer-term indicators are, of course, still bearish because AAPL has been in a bear market for about a year; however, we are seeing signs that the AAPL bear market could be ending. Keep in mind that the signs are short-term and the currently positive evidence could be quickly reversed.
Technical analysis is a windsock, not a crystal ball.


